
Company delivers strong sales, earnings growth; announces productivity savings initiative
Springdale, Arkansas – November 15, 2021 – Tyson Foods, Inc. (NYSE: TSN), one of the world’s largest food companies and a recognized leader in protein with leading brands including Tyson, Jimmy Dean, Hillshire Farm, Ball Park, Wright, Aidells, ibp and State Fair, today reported the following results:
1 The Company reports its financial results in accordance with U.S. generally accepted accounting principles (GAAP). Adjusted sales, adjusted operating income and adjusted net income per share attributable to Tyson (Adjusted EPS) are non-GAAP financial measures. Refer to the end of this release for an explanation and reconciliation of these and other non-GAAP financial measures used in this release to comparable GAAP measures.
Fiscal 2021 Highlights
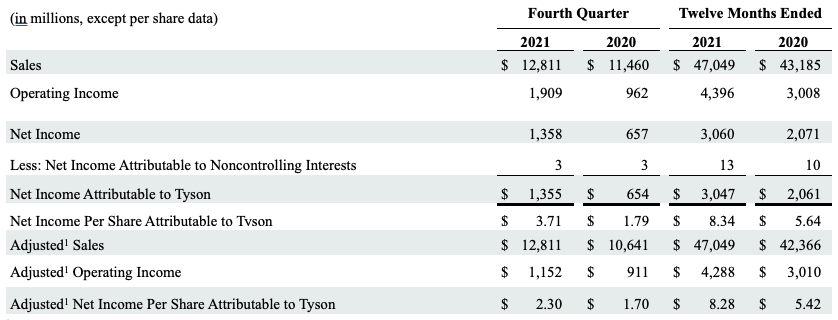
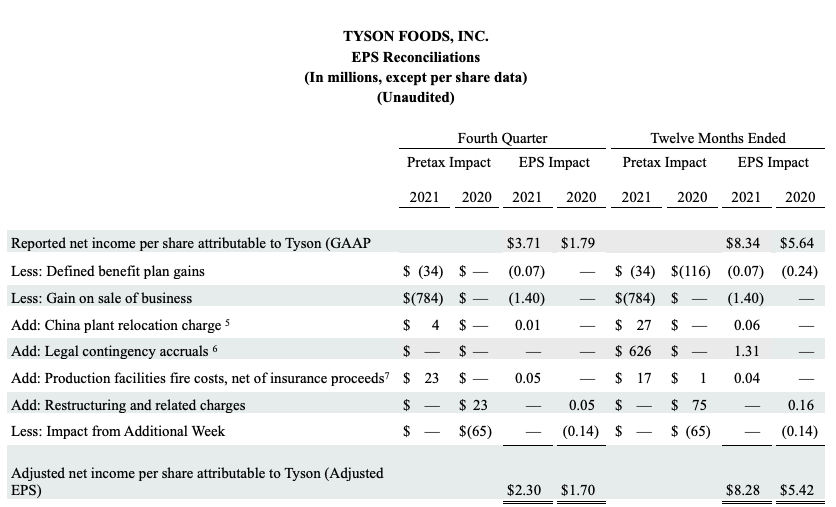
• GAAP EPS of $8.34, up 48% from prior year; Adjusted EPS of $8.28, up 53% from prior year
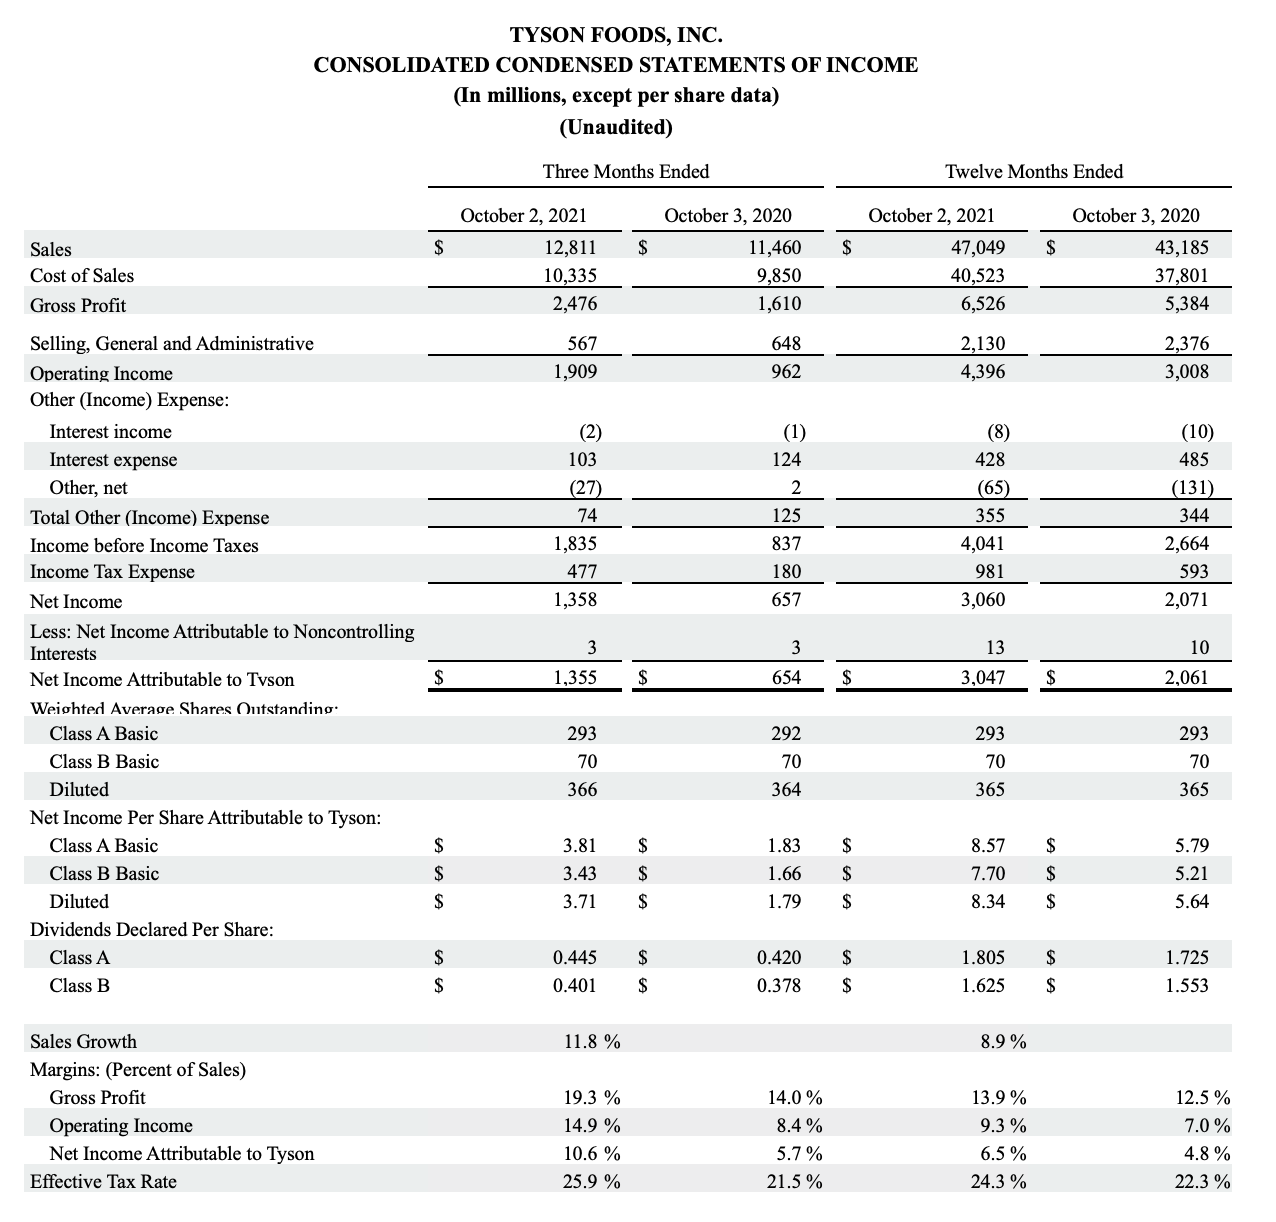
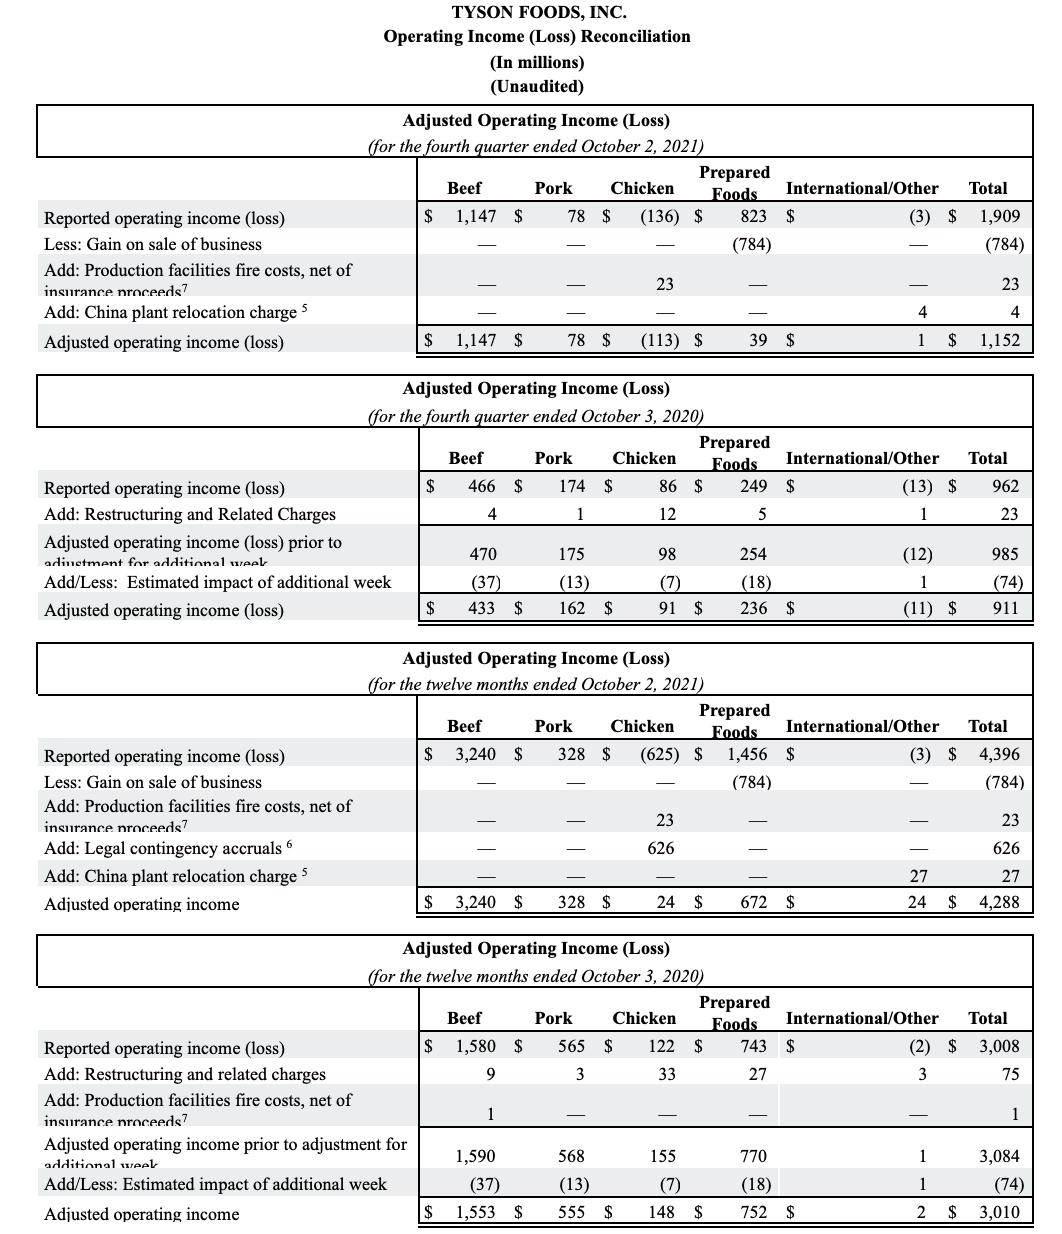
• GAAP operating income of $4,396 million, up 46% from prior year; Adjusted operating income of $4,288 million, up 42% from prior year
• Total Company GAAP operating margin of 9.3%; Adjusted operating margin of 9.0%
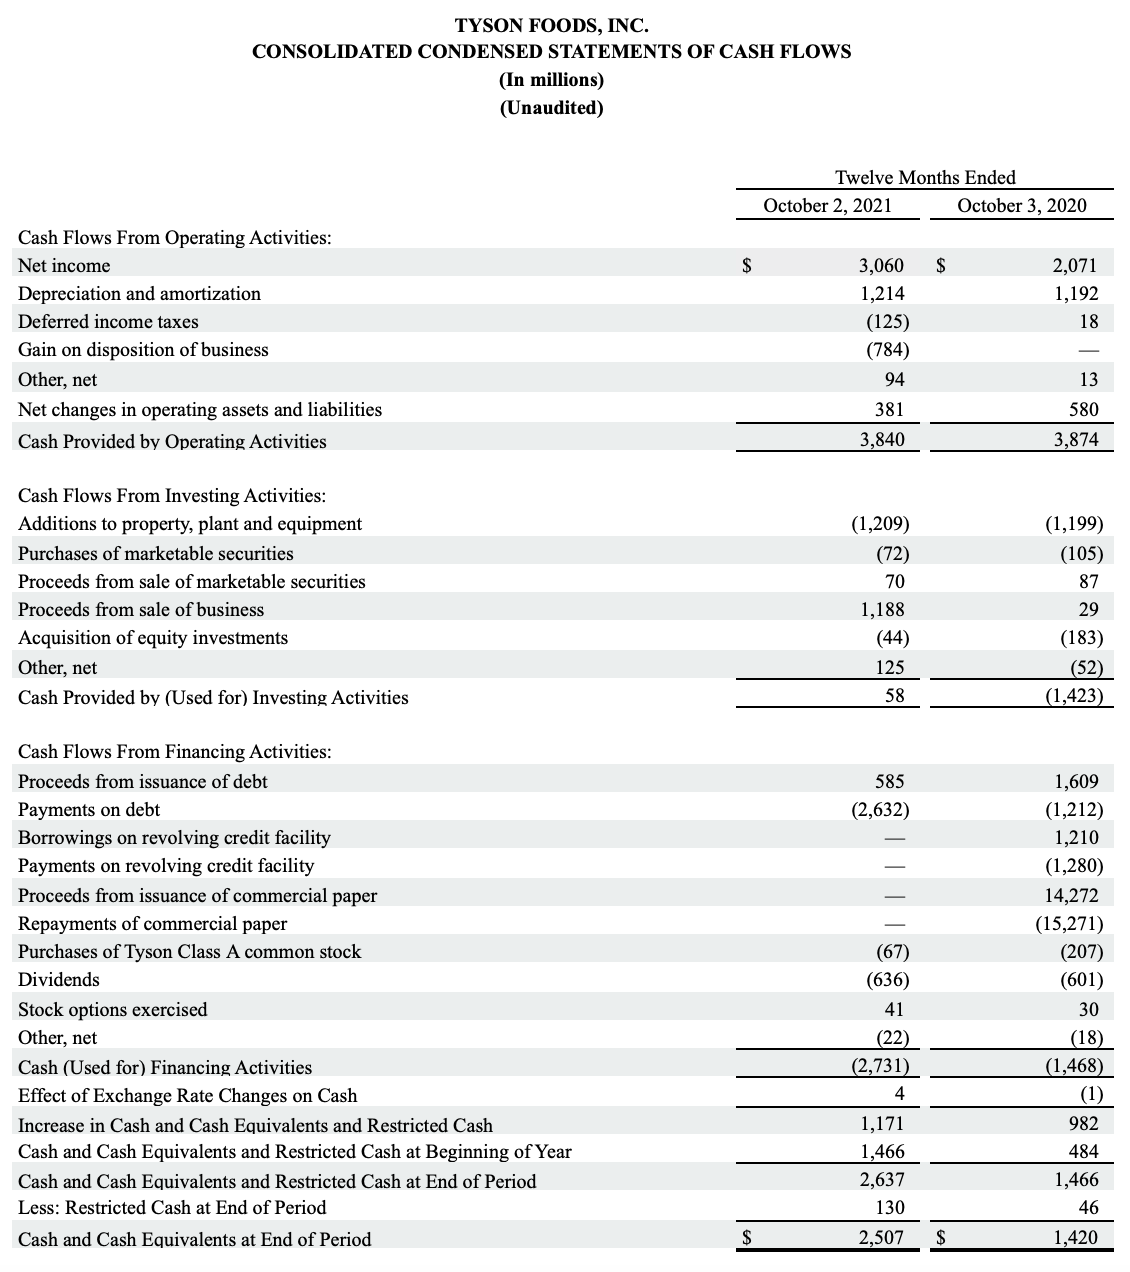
• Generated $3.8 billion of operating cash flows
• Results impacted by approximately $335 million of direct incremental expenses related to COVID-19
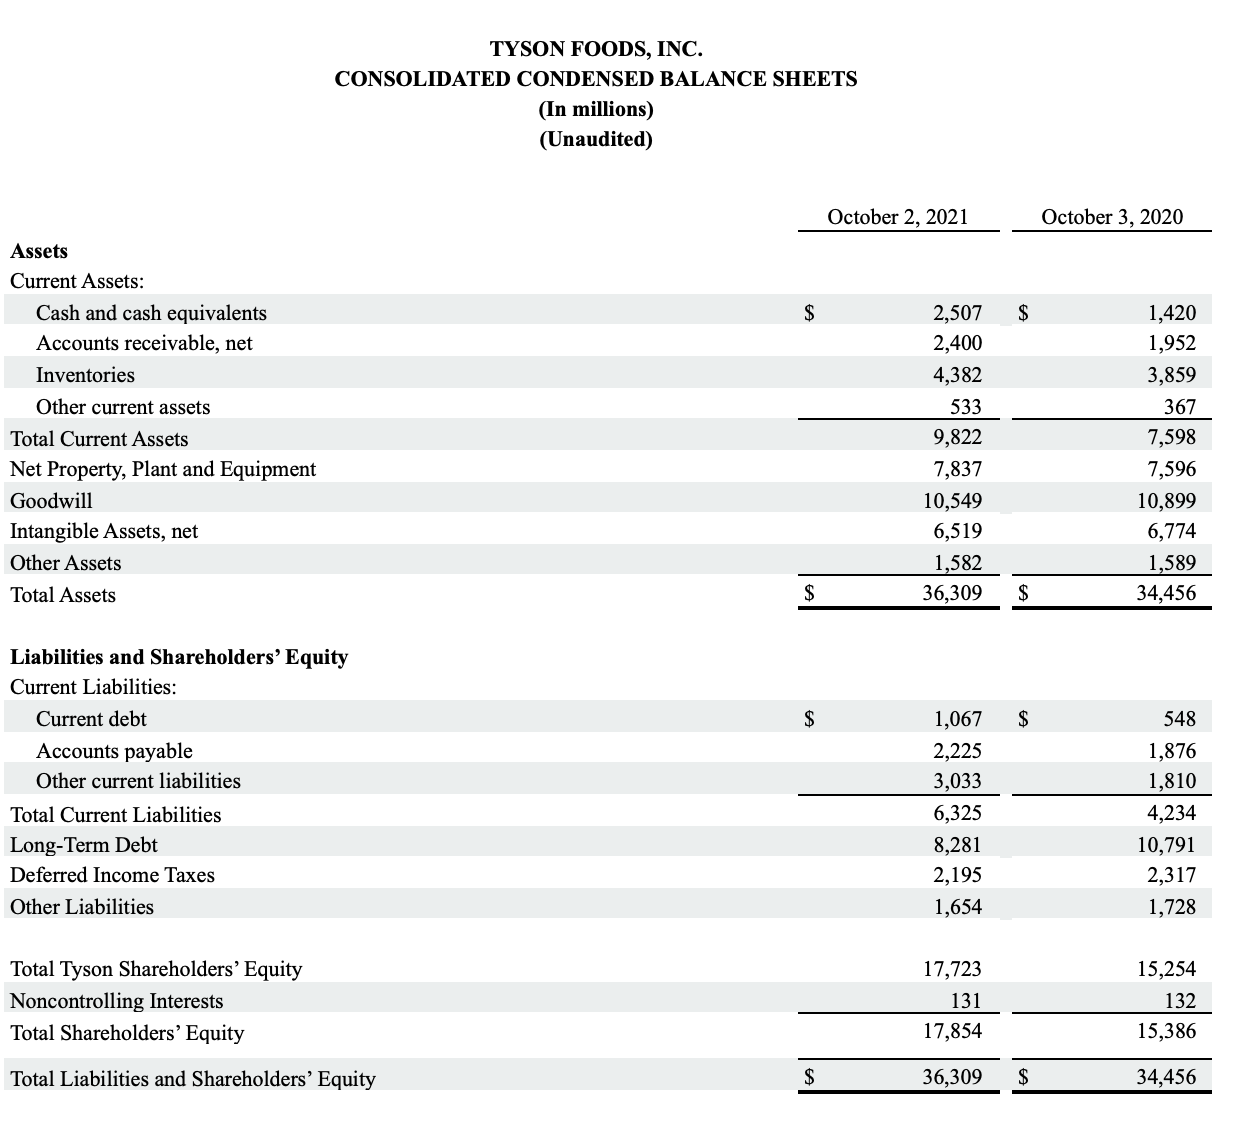
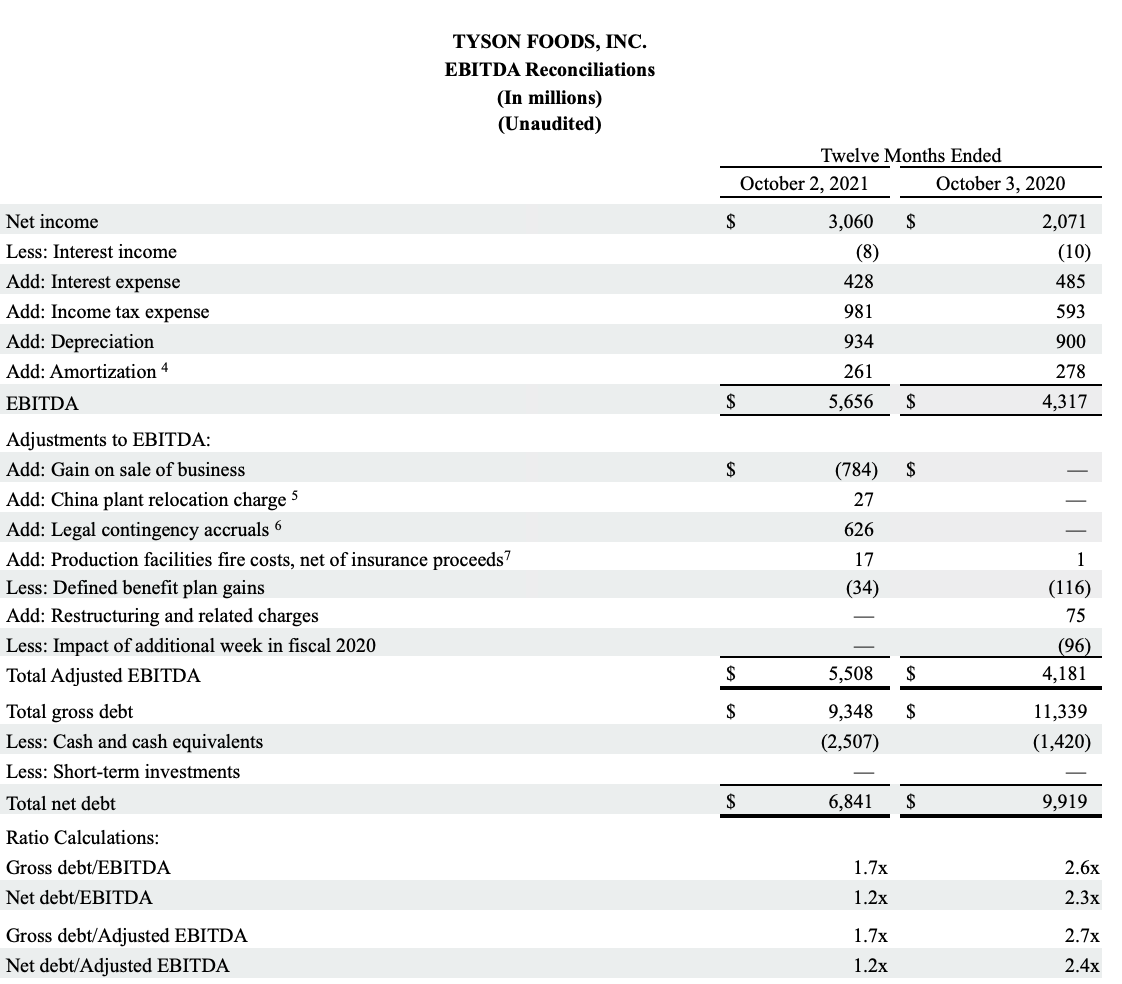
• Reduced total debt by approximately $2 billion; reduced net debt by approximately $3 billion
Fourth Quarter Highlights
• GAAP EPS of $3.71, up 107% from prior year; Adjusted EPS of $2.30, up 35% from prior year
• GAAP operating income of $1,909 million, up 98% from prior year; Adjusted operating income of $1,152 million, up 26% from prior year
• Total Company GAAP operating margin of 14.9%; Adjusted operating margin of 9.0%
• Liquidity of $4.8 billion at October 2, 2021
• Closed the sale of our Pet Treats business for $1.2 billion
“We delivered double digit sales and earnings growth during the fourth quarter and full year, and our performance was supported by our diverse portfolio and continued strength in consumer demand for protein,” said Donnie King, president and CEO of Tyson Foods. "We delivered a record performance in our beef segment and experienced share gains in our retail core business lines, which include our Tyson, Jimmy Dean, Hillshire Farm and Ball Park iconic brands, while supporting the continued recovery in foodservice.”
King added, “To foster continuous improvement and faster decision making, we’re launching a new productivity program designed to deliver more than $1 billion in annual savings by the end of 2024. The focus of this plan includes operational and functional excellence, digital solutions, and automation and advanced technologies.
“We have tremendous opportunity ahead as we work to fulfill growing global demand for safe and nutritious protein products. We’re entering fiscal 2022 with great momentum and are committed to delivering strong returns for shareholders into the future.”
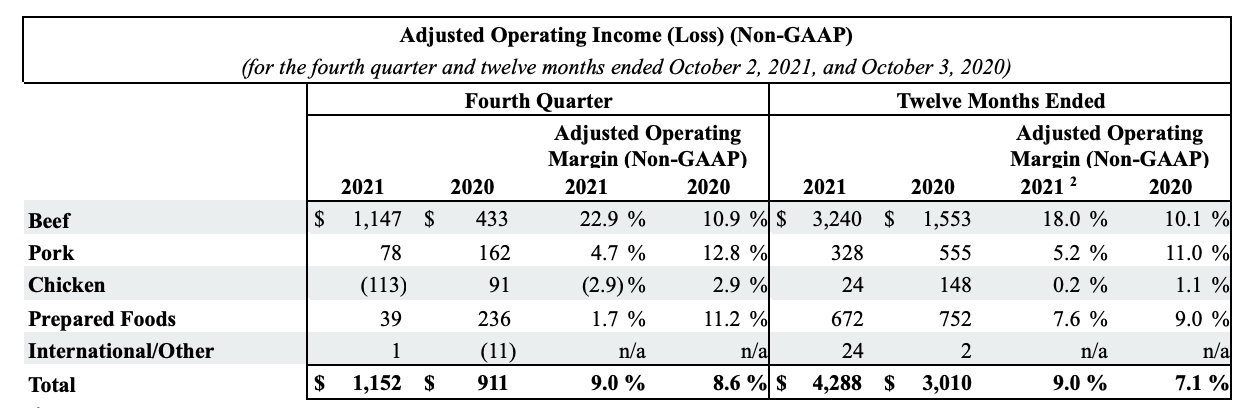
2 Average Price Change and Adjusted Operating Margin for the Chicken Segment and Total Company excludes $545 million for the twelve months ended October 2, 2021 of legal contingency accruals recognized as a reduction to Sales.
Note: Adjusted sales, adjusted operating income (loss) and adjusted operating margin are non-GAAP financial measures and are explained and reconciled to comparable GAAP measures at the end of this release. Adjusted sales, adjusted operating income (loss), adjusted volume change, adjusted average price change and adjusted operating margin for the fourth quarter and twelve months of fiscal 2020 are presented on a 13-week and 52-week basis, respectively.
COVID-19 EXPENSES
We incurred direct incremental expenses associated with the impact of COVID-19 totaling approximately $65 million and $335 million for the fourth quarter and twelve months of fiscal 2021, respectively. These direct incremental expenses primarily included team member costs associated with worker health and availability including direct costs for personal protection equipment, production facility sanitization, COVID-19 testing and vaccinations, donations, product downgrades, rendered product and certain professional fees, partially offset by CARES Act credits. We anticipate some of these direct incremental expenses to become permanent over time. Other indirect costs associated with COVID-19 are not reflected in these amounts, including costs associated with raw materials, distribution and transportation, plant underutilization and reconfiguration, premiums paid to cattle producers and pricing discounts.
SUMMARY OF SEGMENT RESULTS
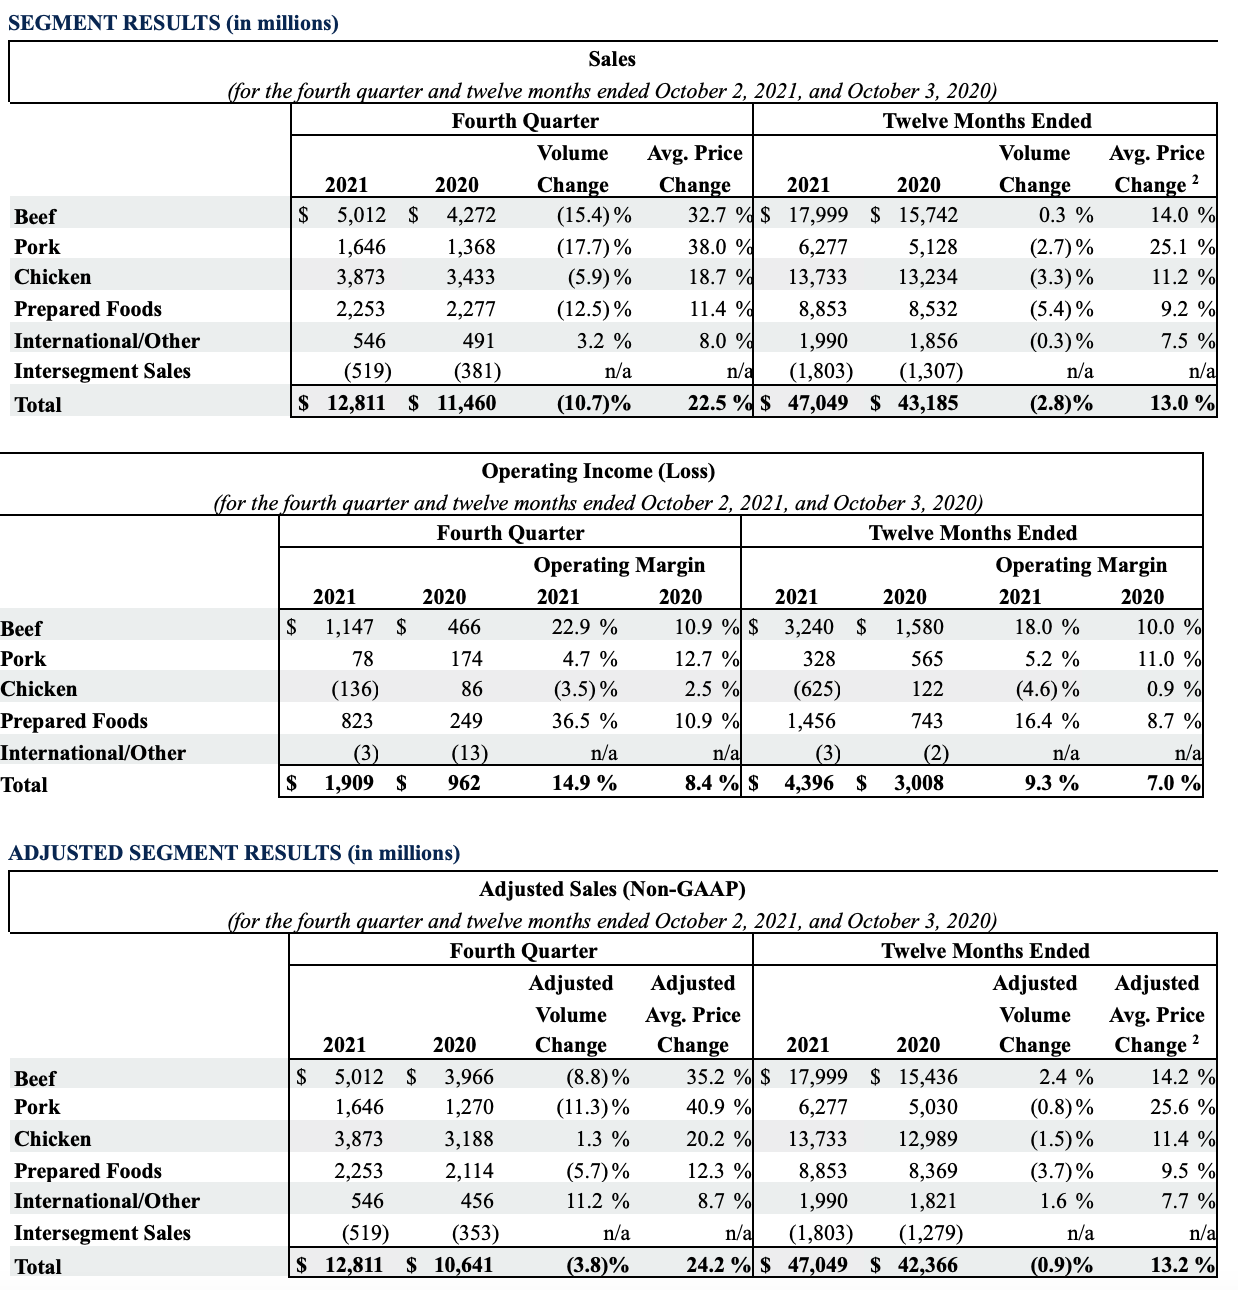
Beef
Sales volume decreased 15.4% during the fourth quarter of fiscal 2021, or decreased 8.8% after removing the impact of an additional week in 2020, due to the impact associated with a challenging labor environment, partially offset by strong global demand. Sales volume increased 0.3% during fiscal 2021, or increased 2.4% after removing the impact of an additional week in fiscal 2020, due to strong global demand, partially offset by the impacts associated with a challenging labor environment and severe weather. Average sales price increased as input costs such as live cattle, labor, freight and transportation costs increased and demand for our beef products remained strong. Operating income increased due to strong demand as we continued to optimize revenues relative to live cattle supply, partially offset by production inefficiencies due to labor challenges. Additionally, operating income in fiscal 2021 was impacted by a cattle supplier's misappropriation of Company funds, which resulted in a $55 million gain related to the recovery of cattle inventory as compared to a $106 million loss recognized in fiscal 2020.
Pork
Sales volume decreased 17.7% during the fourth quarter of fiscal 2021, or decreased 11.3% after removing the impact of an additional week in 2020, and decreased 2.7% in fiscal 2021, or decreased 0.8% after removing the impact of an additional week in 2020, due to the impacts associated with lower hog supplies and a challenging labor environment, partially offset by strong global demand. Average sales price increased as input costs such as live hog, labor, freight and transportation costs increased and demand for our pork products remained strong. Operating income decreased primarily due to lower hog supplies relative to industry capacity as well as production inefficiencies related to COVID-19 and a challenging labor environment, partially offset by a reduction in direct incremental expenses related to COVID-19 in fiscal 2021 as compared to fiscal 2020. Additionally, volatile market conditions resulted in net derivative losses of $90 million in fiscal 2021 and net derivative gains of $70 million in fiscal 2020, which were offset by the impacts of related physical purchase transactions.
Chicken
Sales volume decreased 5.9% during the fourth quarter of fiscal 2021, or increased 1.3% after removing the impact of an additional week in 2020, primarily due to increased demand in the foodservice channel. Sales volume decreased 3.3% for fiscal 2021, or decreased 1.5% after removing the impact of an additional week in 2020. Despite a strong demand environment, volume decreased due to the impacts associated with a decline in hatch rate, a challenging labor environment and disruptions due to severe weather in the second quarter of fiscal 2021. Average sales price increased due to favorable sales mix and inflationary market conditions. Operating income decreased during the fourth quarter of fiscal 2021 primarily due to $325 million of higher feed ingredient costs, $75 million of net derivative losses in the fourth quarter of fiscal 2021 as compared to $45 million of net derivative gains in the fourth quarter of fiscal 2020, increased supply chain costs and a $23 million expense related to a fire at a production facility, partially offset by favorable product mix. Operating income decreased during fiscal 2021 primarily due to a $626 million loss from the recognition of legal contingency accruals, $735 million of higher feed ingredient costs as compared to fiscal 2020, increased supply chain costs, $23 million of expenses related to a fire at a production facility, decline in hatch rate and disruptions due to severe weather. This was partially offset by favorable product mix, reduced direct incremental expense associated with COVID-19 and $65 million of net derivative gains in fiscal 2021 as compared to $50 million of net derivative losses in fiscal 2020.
Prepared Foods
Sales volume decreased 12.5% during the fourth quarter of fiscal 2021, or decreased 5.7% after removing the impact of an additional week in 2020, due to lower production throughput primarily associated with a challenging labor and supply environment. Sales volume decreased 5.4% for fiscal 2021, or decreased 3.7% after removing the impact of an additional week in 2020, driven by lower production throughput primarily associated with a challenging labor and supply environment and reduced foodservice demand in the first half of fiscal 2021. Average sales price increased due to favorable product mix and inflation-justified pricing. Operating income increased in the fourth quarter of fiscal 2021 due to the recognition of a $784 million gain from the sale of our pet treats business and favorable pricing and product mix, which were offset by the impact of inflationary market conditions including $255 million of increased raw materials and other input costs, increased supply chain costs and a challenging labor environment. Operating income increased during fiscal 2021 due to the recognition of a $784 million gain from the sale of our pet treats business, lower commercial spend as well as favorable pricing and product mix, which were partially offset by the impact of inflationary market conditions including a $520 million increase in raw material costs during fiscal 2021, increased supply chain costs and a challenging labor environment.
OUTLOOK
For fiscal 2022, the United States Department of Agriculture (“USDA”) indicates domestic protein production (beef, pork, chicken and turkey) should increase slightly as compared to fiscal 2021 levels. The following is a summary of the outlook for each of our segments, as well as an outlook for revenues, capital expenditures, net interest expense, liquidity, tax rate and dividends for fiscal 2022.3
Beginning in fiscal 2022, we are launching a new productivity program, which is designed to drive a better, faster and more agile organization that is supported by a culture of continuous improvement and faster decision making. We are targeting $1 billion in productivity savings by the end of fiscal 2024 and $300 million to $400 million in fiscal 2022, relative to a fiscal 2021 cost baseline.
Beef
USDA projects domestic production will decrease approximately 2% in fiscal 2022 as compared to fiscal 2021. We anticipate another strong year with adjusted operating margin between 9% to 11% in fiscal 2022. We expect the first half of the fiscal year will be stronger than the second half as a combination of higher utilization and demand for cattle may result in a narrowing spread.
Pork
USDA projects domestic production will decrease approximately 2% in fiscal 2022 as compared to fiscal 2021. We believe our Pork segment's adjusted operating margin will be 5% to 7% in fiscal 2022.
Chicken
USDA projects chicken production will increase slightly in fiscal 2022 as compared to fiscal 2021. We anticipate an adjusted operating margin at the lower end of 5% to 7% for fiscal 2022 as our adjusted operating margin should achieve this on a run rate basis by the middle of the year resulting in overall stronger performance in the second half of the fiscal year.
Prepared Foods
We believe our adjusted operating margin will be around 7% to 9% in fiscal 2022. We will remain disciplined in our pricing initiatives to ensure additional inflationary pressures are passed through to customers, while also working diligently to deliver productivity savings to reduce costs.
International/Other
We anticipate improved results from our foreign operations in fiscal 2022.
Revenue
We expect sales to approximate $49 billion to $51 billion in fiscal 2022.
Capital Expenditures
We expect capital expenditures of approximately $2 billion for fiscal 2022. Capital expenditures include spending for capacity expansion and utilization, automation to alleviate labor challenges and brand and product innovation.
Net Interest Expense
We expect net interest expense to approximate $380 million for fiscal 2022.
Liquidity
We expect total liquidity, which was approximately $4.8 billion at October 2, 2021, to remain above our minimum liquidity target of $1.0 billion.
Tax Rate
We currently expect our adjusted effective tax rate to be around 23% in fiscal 2022.
Dividends
Effective November 12, 2021, the Board of Directors increased the quarterly dividend previously declared on August 12, 2021, to $0.46 per share on our Class A common stock and $0.414 per share on our Class B common stock. The increased quarterly dividend is payable on December 15, 2021, to shareholders of record at the close of business on December 1, 2021. The Board also declared a quarterly dividend of $0.46 per share on our Class A common stock and $0.414 per share on our Class B common stock, payable on March 15, 2022, to shareholders of record at the close of business on March 1, 2022. We anticipate the remaining quarterly dividends in fiscal 2022 will be $0.46 and $0.414 per share of our Class A and Class B stock, respectively. This results in an annual dividend rate in fiscal 2022 of $1.84 for Class A shares and $1.656 for Class B shares, or a 3% increase compared to the fiscal 2021 annual dividend rate.
3 The Company is not able to reconcile its full-year fiscal 2022 projected adjusted results to its fiscal 2022 projected GAAP results because certain information necessary to calculate such measures on a GAAP basis is unavailable or dependent on the timing of future events outside of our control. Therefore, because of the uncertainty and variability of the nature of the amount of future adjustments, such as legal contingency accruals and other significant items which could be significant, the Company is unable to provide a reconciliation for these forward-looking non-GAAP measures without unreasonable effort. Adjusted operating margin should not be considered a substitute for operating margin or any other measures of financial performance reported in accordance with GAAP. Investors should rely primarily on the Company’s GAAP results and use non-GAAP financial measures only supplementally in making investment decisions.
4 Excludes the amortization of debt issuance and debt discount expense of $19 million and $14 million for the twelve months ended October 2, 2021 and October 3, 2020, respectively, as it is included in Interest expense.
5 Relates to a plant relocation from a government land expropriation and includes accelerated depreciation and team member related charges recognized as an increase of Cost of Sales.
6 Legal contingency accruals included $545 million recognized as a reduction of Sales and $81 million recognized as an increase of Cost of Sales.
7 Relates to fires at production facilities in Chicken in the fourth quarter of fiscal 2021 and Beef in the fourth quarter of fiscal 2019. Amount includes direct incremental costs, net of insurance proceeds, of $23 million net expense recognized in Cost of Sales and $6 million net proceeds recognized in Other, net for fiscal 2021.
EBITDA is defined as net income before interest, income taxes, depreciation and amortization. Net debt to EBITDA (Adjusted EBITDA) represents the ratio of our debt, net of cash, cash equivalents and short-term investments, to EBITDA (and to Adjusted EBITDA). EBITDA, Adjusted EBITDA, net debt to EBITDA and net debt to Adjusted EBITDA are presented as supplemental financial measurements in the evaluation of our business. Adjusted EBITDA is a tool intended to assist our management and investors in comparing our performance on a consistent basis for purposes of business decision-making by removing the impact of certain items that management believes do not directly reflect our core operations on an ongoing basis.
We believe the presentation of these financial measures helps management and investors to assess our operating performance from period to period, including our ability to generate earnings sufficient to service our debt, enhances understanding of our financial performance and highlights operational trends. These measures are widely used by investors and rating agencies in the valuation, comparison, rating and investment recommendations of companies; however, the measurements of EBITDA (and Adjusted EBITDA) and net debt to EBITDA (and to Adjusted EBITDA) may not be comparable to those of other companies, which may limit their usefulness as comparative measures. EBITDA (and Adjusted EBITDA) and net debt to EBITDA (and to Adjusted EBITDA) are not measures required by or calculated in accordance with GAAP and should not be considered as substitutes for net income or any other measure of financial performance reported in accordance with GAAP or as a measure of operating cash flow or liquidity. EBITDA (and Adjusted EBITDA) is a useful tool for assessing, but is not a reliable indicator of, our ability to generate cash to service our debt obligations because certain of the items added to net income to determine EBITDA (and Adjusted EBITDA) involve outlays of cash. As a result, actual cash available to service our debt obligations will be different from EBITDA (and Adjusted EBITDA). Investors should rely primarily on our GAAP results and use non-GAAP financial measures only supplementally in making investment decisions.
Adjusted net income per share attributable to Tyson (Adjusted EPS) is presented as a supplementary measure of our financial performance that is not required by, or presented in accordance with, GAAP. We use Adjusted EPS as an internal performance measurement and as one criterion for evaluating our performance relative to that of our peers. We believe Adjusted EPS is meaningful to our investors to enhance their understanding of our financial performance and is frequently used by securities analysts, investors and other interested parties to compare our performance with the performance of other companies that report Adjusted EPS. Further, we believe that Adjusted EPS is a useful measure because it improves comparability of results of operations from period to period. Adjusted EPS should not be considered a substitute for net income per share attributable to Tyson or any other measure of financial performance reported in accordance with GAAP. Investors should rely primarily on our GAAP results and use non-GAAP financial measures only supplementally in making investment decisions. Our calculation of Adjusted EPS may not be comparable to similarly titled measures reported by other companies.
Adjusted operating income (loss) is presented as a supplementary measure of our operating performance that is not required by, or presented in accordance with, GAAP. We use adjusted operating income (loss) as an internal performance measurement and as one criterion for evaluating our performance relative to that of our peers. We believe adjusted operating income (loss) is meaningful to our investors to enhance their understanding of our operating performance and is frequently used by securities analysts, investors and other interested parties to compare our performance with the performance of other companies that report adjusted operating income (loss). Further, we believe that adjusted operating income (loss) is a useful measure because it improves comparability of results of operations from period to period. Adjusted operating income (loss) should not be considered as a substitute for operating income (loss) or any other measure of operating performance reported in accordance with GAAP. Investors should rely primarily on our GAAP results and use non-GAAP financial measures only supplementally in making investment decisions. Our calculation of adjusted operating income (loss) may not be comparable to similarly titled measures reported by other companies.
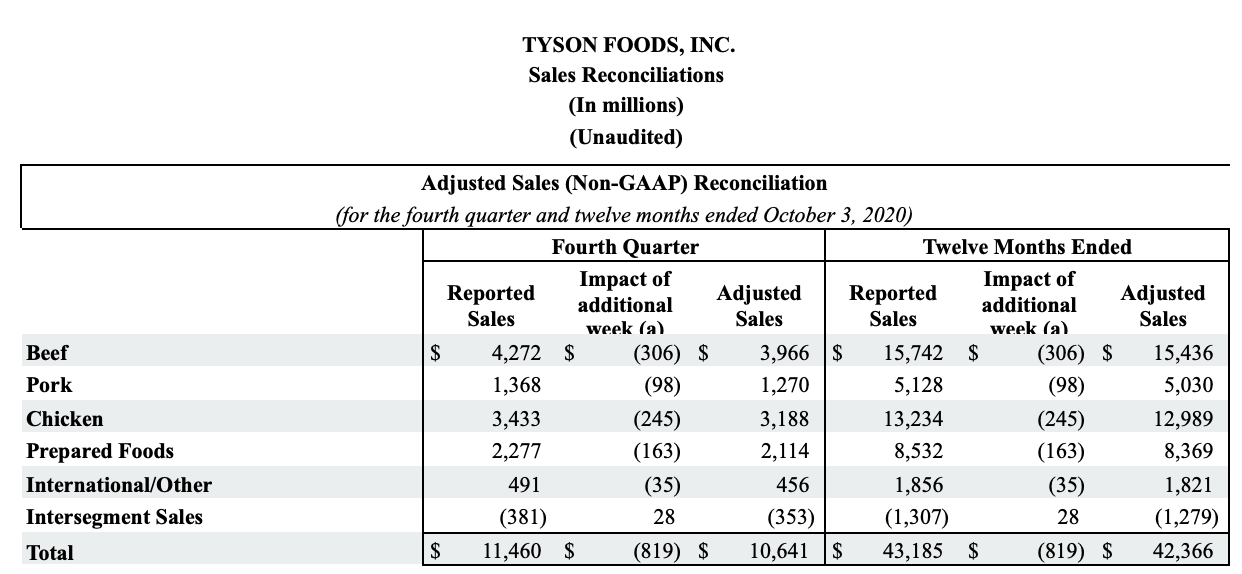
(a) The estimated impact of the additional week in the fourth quarter and twelve months of fiscal 2020 was calculated by dividing the fourth quarter's reported Sales by 14 weeks.
Adjusted sales (due to the impact of the additional week in the fourth quarter of fiscal 2020) is presented as a supplementary measure of our financial performance that is not required by, or presented in accordance with, GAAP. We use adjusted sales as an internal performance measurement and as one criterion for evaluating our performance relative to that of our peers. We believe adjusted sales is meaningful to our investors to enhance their understanding of our financial performance and is frequently used by securities analysts, investors and other interested parties to compare our performance with the performance of other companies that report adjusted sales. Further, we believe that adjusted sales is a useful measure because it improves comparability of results of operations from period to period when a fiscal year results in a 53-week accounting cycle. Adjusted sales should not be considered as a substitute for sales or any other measure of financial performance reported in accordance with GAAP. Investors should rely primarily on our GAAP results and use non-GAAP financial measures only supplementally in making investment decisions. Our calculation of adjusted sales may not be comparable to similarly titled measures reported by other companies.
About Tyson Foods, Inc.
Tyson Foods, Inc. (NYSE: TSN) is one of the world’s largest food companies and a recognized leader in protein. Founded in 1935 by John W. Tyson and grown under three generations of family leadership, the Company has a broad portfolio of products and brands like Tyson®, Jimmy Dean®, Hillshire Farm®, Ball Park®, Wright®, Aidells®, ibp® and State Fair®. Tyson Foods innovates continually to make protein more sustainable, tailor food for everywhere it’s available and raise the world’s expectations for how much good food can do. Headquartered in Springdale, Arkansas, the Company had approximately 137,000 team members at October 2, 2021. Through its Core Values, Tyson Foods strives to operate with integrity, create value for its shareholders, customers, communities and team members and serve as a steward of the animals, land and environment entrusted to it. Visit www.tysonfoods.com.
Conference Call Information and Other Selected Data
A conference call to discuss the Company's financial results will be held at 9 a.m. Eastern Monday, November 15, 2021. We encourage participants to pre-register for the conference call using the following link: https://dpregister.com/sreg/10160190/ed495e7d1a. Callers who pre-register will be given a conference passcode and unique PIN to gain immediate access to the call and bypass the live operator. Participants may pre-register at any time, including up to and after the call has started. Those without internet access or who are unable to pre-register may dial-in by calling toll free 1-844-890-1795 or international toll 1-412-717-9589. To listen to the live webcast or to view the accompanying slides, go to the Company’s investor website at http://ir.tyson.com. The webcast also can be accessed by using the direct link: https://event.on24.com/wcc/r/3404985/4CF2B9F967075ABCA2D308573042867C. For those who cannot participate at the scheduled time, a replay of the live webcast and the accompanying slides will be available at http://ir.tyson.com until Wednesday, December 15, 2021. A telephone replay will also be available until Wednesday, December 15, 2021, toll free at 1-877-344-7529, international toll 1-412-317-0088 or Canada toll free 855-669-9658. The replay access code is 10160190. Financial information, such as this news release, as well as other supplemental data, can be accessed from the Company's web site at http://ir.tyson.com.
Forward-Looking Statements
Certain information in this report constitutes forward-looking statements as contemplated by the Private Securities Litigation Reform Act of 1995. Such forward-looking statements include, but are not limited to, current views and estimates of our outlook for fiscal 2021, other future economic circumstances, industry conditions in domestic and international markets, our performance and financial results (e.g., debt levels, return on invested capital, value-added product growth, capital expenditures, tax rates, access to foreign markets and dividend policy). These forward-looking statements are subject to a number of factors and uncertainties that could cause our actual results and experiences to differ materially from anticipated results and expectations expressed in such forward-looking statements. We wish to caution readers not to place undue reliance on any forward-looking statements, which are expressly qualified in their entirety by this cautionary statement and speak only as of the date made. We undertake no obligation to update any forward-looking statements, whether as a result of new information, future events or otherwise. Among the factors that may cause actual results and experiences to differ from anticipated results and expectations expressed in such forward-looking statements are the following: (i) the COVID-19 global pandemic and associated responses thereto have had an adverse impact on our business and operations, and the extent that the COVID-19 pandemic continues to impact us will depend on future developments, which are highly uncertain and cannot be predicted with confidence, including the scope, severity and duration of the pandemic, and public adoption rates of COVID-19 vaccines and their effectiveness against variants of COVID-19, including the Delta variant; (ii) the effectiveness of our financial excellence programs; (iii) access to foreign markets together with foreign economic conditions, including currency fluctuations, import/export restrictions and foreign politics; (iv) cyber incidents, security breaches or other disruptions of our information technology systems; (v) risks associated with our failure to consummate favorable acquisition transactions or integrate certain acquisitions' operations; (vi) the Tyson Limited Partnership’s ability to exercise significant control over the Company; (vii) fluctuations in the cost and availability of inputs and raw materials, such as live cattle, live swine, feed grains (including corn and soybean meal) and energy; (viii) market conditions for finished products, including competition from other global and domestic food processors, supply and pricing of competing products and alternative proteins and demand for alternative proteins; (ix) outbreak of a livestock disease (such as African swine fever (ASF), avian influenza (AI) or bovine spongiform encephalopathy (BSE)), which could have an adverse effect on livestock we own, the availability of livestock we purchase, consumer perception of certain protein products or our ability to access certain domestic and foreign markets; (x) changes in consumer preference and diets and our ability to identify and react to consumer trends; (xi) effectiveness of advertising and marketing programs; (xii) significant marketing plan changes by large customers or loss of one or more large customers; (xiii) our ability to leverage brand value propositions; (xiv) changes in availability and relative costs of labor and contract farmers and our ability to maintain good relationships with team members, labor unions, contract farmers and independent producers providing us livestock; (xv) issues related to food safety, including costs resulting from product recalls, regulatory compliance and any related claims or litigation; (xvi) compliance with and changes to regulations and laws (both domestic and foreign), including changes in accounting standards, tax laws, environmental laws, agricultural laws and occupational, health and safety laws; (xvii) adverse results from litigation; (xviii) risks associated with leverage, including cost increases due to rising interest rates or changes in debt ratings or outlook; (xix) impairment in the carrying value of our goodwill or indefinite life intangible assets; (xx) our participation in a multiemployer pension plan; (xxi) volatility in capital markets or interest rates; (xxii) risks associated with our commodity purchasing activities; (xxiii) the effect of, or changes in, general economic conditions; (xxiv) impacts on our operations caused by factors and forces beyond our control, such as natural disasters, fire, bioterrorism, pandemics or extreme weather; (xxv) failure to maximize or assert our intellectual property rights; (xxvi) effects related to changes in tax rates, valuation of deferred tax assets and liabilities, or tax laws and their interpretation; (xxvii) the effectiveness of our internal control over financial reporting, including identification of material weaknesses; and (xxviii) the other risks and uncertainties detailed from time to time in our filings with the Securities and Exchange Commission, including those included under the captions "Risk Factors" and "Management's Discussion and Analysis of Financial Condition and Results of Operations" in our most recent Annual Report on Form 10-K and Quarterly reports on Form 10-Q.
Media Contact: Gary Mickelson, 479-290-6111
Investor Contact: Megan Britt, 479-236-4927 Source: Tyson Foods, Inc.
Category: IR, Newsroom