
Springdale, Arkansas – August 7, 2017 – Tyson Foods, Inc. (NYSE: TSN), one of the world’s largest food companies and a recognized leader in protein with leading brands including Tyson®, Jimmy Dean®, Hillshire Farm®, Ball Park®, Wright®, Aidells®, ibp® and State Fair®, today reported the following results:
1Adjusted operating income and adjusted net income per share attributable to Tyson are non-GAAP financial measures and are explained and reconciled to a comparable GAAP measure at the end of this release. Adjusted net income per share attributable to Tyson guidance is provided on a non-GAAP basis because certain information necessary to calculate such measure on a GAAP basis is unavailable, dependent on future events outside of our control and cannot be predicted without unreasonable efforts by the Company. A further explanation of providing non-GAAP guidance is included at the end of this release.
First Nine Months Highlights
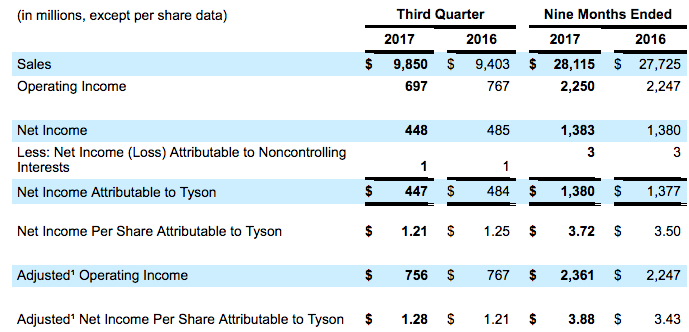
- Record GAAP EPS of $3.72, up 6% from last year; Record Adjusted EPS of $3.88, up 13% from last year
- Record GAAP operating income of $2,250 million; Record Adjusted operating income of $2,361 million
Third Quarter Highlights
- GAAP EPS of $1.21, down 3% from last year; Adjusted EPS of $1.28, up 6% from last year
- GAAP operating income of $697 million; Adjusted operating income of $756 million
- Total company GAAP operating margin at 7.1%; Adjusted operating margin at 7.7%
- Captured $167 million in total Hillshire Brands synergies; $17 million incremental synergies over Q3'16
Guidance
- Adjusted1 EPS guidance of $4.95-$5.05, representing a 13% increase from adjusted EPS of fiscal 2016
- Expect to realize AdvancePierre Foods Holdings, Inc. net synergies in excess of $200 million by fiscal 2020
“Our team delivered solid results in our third quarter with three of four segments on a GAAP basis and all four segments on an adjusted basis achieving operating margins in or above their normalized ranges. Our total net sales grew 4.8% compared to third quarter of 2016, and every segment delivered volume growth behind a strong start to grilling season and new product innovation,” said Tom Hayes, president and chief executive officer of Tyson Foods.
“The Beef and Pork segments were very strong performers in the third quarter, and continued generating cash to fuel investments in our value-added Chicken and Prepared Foods businesses. Volume growth in our Core 9 retail and Focus 5 foodservice businesses again outpaced the industry as we built momentum with customers by satisfying consumer appetites for value-added protein and fresh foods.
“The team worked quickly to complete the acquisition of AdvancePierre in June, and the integration is well underway. We're collaborating as one team and finding rich opportunities for improvement in agility, revenue growth management, and innovation to accelerate the top line. The addition of AdvancePierre will further our leadership position in prepared foods as we capitalize on the fast-growing convenience store channel and the fresh retail perimeter across all day parts. Additionally, we’re seeing even greater potential for leveraging our complementary businesses for efficiency. Given the early success of our integration efforts, we now anticipate cumulative net synergies exceeding $200 million within three years.
“We're nearing the end of a record year of earnings per share and operating income, and we’re looking ahead to fiscal 2018 with great enthusiasm. We anticipate delivering another record year through differentiated capabilities, exceptionally strong brands and disciplined execution. We expect strong global demand for protein and superior focus on the fundamentals will contribute to a favorable operating environment in our Beef and Pork segments. In our Chicken segment, we will build our business through continued capacity expansion, No Antibiotics Ever and organic products, innovation and strong support of the Tyson brand. In the Prepared Foods segment, we continue to strengthen our business through improved execution in our foodservice operations, on-trend protein innovation and the integration of AdvancePierre.
“Tyson Foods is positioned to lead consumer fresh goods through our unique capabilities. We bring together fresh food production and distribution, deep culinary expertise and consumer demand generation along with #1 brands and unmatched scale. At the same time, we operate with agility and are laser focused on creating value for our shareholders. This is an exciting time at Tyson Foods as we build a powerful engine to deliver consistent, profitable growth over time.”
Note: On June 7, 2017, we acquired and consolidated AdvancePierre Foods Holdings, Inc. ("AdvancePierre"), a producer and distributor of value-added, convenient, ready-to-eat sandwiches, sandwich components and other entrées and snacks. AdvancePierre's results from operations subsequent to the acquisition closing are included in the Prepared Foods and Chicken segments.
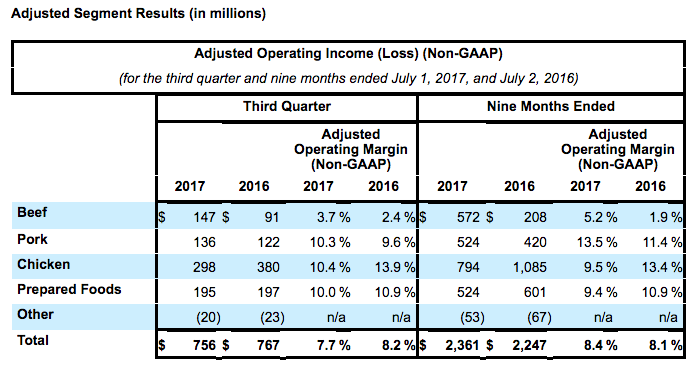
Adjustments to segment results for the third quarter of fiscal 2017
- Chicken operating income was adjusted for the following:
- $4 million for AdvancePierre purchase accounting and acquisition related costs
- Prepared Foods operating income was adjusted for the following:
- $21 million for AdvancePierre purchase accounting and acquisition related costs
- Other operating loss was adjusted for the following:
- $34 million for AdvancePierre acquisition related costs
Adjustments to segment results for the nine months of fiscal 2017
- Chicken operating income was adjusted for the following:
- $4 million for AdvancePierre purchase accounting and acquisition related costs
- Prepared Foods operating income was adjusted for the following:
- $21 million for AdvancePierre purchase accounting and acquisition related costs
- $52 million for an impairment related to our San Diego operation
- Other operating loss was adjusted for the following:
- $34 million for AdvancePierre acquisition related costs
Adjusted operating income and adjusted operating margin are presented as supplementary measures in the evaluation of our business that are not required by, or presented in accordance with, GAAP. We use adjusted operating income and adjusted operating margin as internal performance measurements and as two criteria for evaluating our performance relative to that of our peers. We believe adjusted operating income and adjusted operating margin are meaningful to our investors to enhance their understanding of our financial performance and are frequently used by securities analysts, investors and other interested parties to compare our performance with the performance of other companies that report adjusted operating income and adjusted operating margin. Further, we believe that adjusted operating income and adjusted operating margin are useful measures because they improve comparability of results of operations from period to period. Adjusted operating income and adjusted operating margin should not be considered as substitutes for operating income, operating margin or any other measure of operating performance reported in accordance with GAAP. Investors should rely primarily on our GAAP results and use non-GAAP financial measures only supplementally in making investment decisions. Our calculation of adjusted operating income and adjusted operating margin may not be comparable to similarly titled measures reported by other companies.
Summary of Segment Results
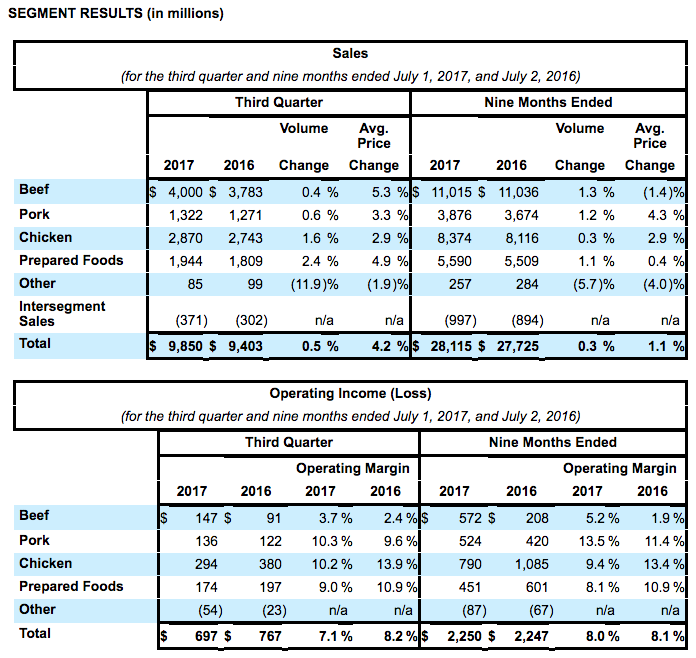
- Beef - Sales volume increased for the nine months and third quarter of fiscal 2017 due to improved availability of cattle supply, stronger domestic demand for our beef products and increased exports. Average sales price for the nine months of fiscal 2017 decreased due to increased availability of live cattle supply and lower livestock cost. Average sales price for the third quarter of fiscal 2017 increased as demand for our beef products and strong exports outpaced the increase in live cattle supplies. Operating income increased due to more favorable market conditions as we maximized our revenues relative to the decline in live fed cattle costs, partially offset by higher operating costs.
- Pork - Sales volume increased for the nine months and third quarter of fiscal 2017 due to strong demand for our pork products and increased exports. Average sales price increased as demand for our pork products and strong exports outpaced the increase in live hog supplies. Operating income increased as we maximized our revenues relative to the live hog markets, partially attributable to stronger export markets and operational and mix performance, which were partially offset by higher operating costs.
- Chicken - Sales volume was up slightly in the nine months of fiscal 2017 due to better demand for our chicken products, partially offset by operational disruptions from fires at two of our plants and decreased rendered product sales. Sales volume was up for the third quarter of fiscal 2017 due to better demand for our chicken products. Average sales price increased for the nine months and third quarter of fiscal 2017 due to sales mix changes. Operating income for the nine months and third quarter of fiscal 2017 was below prior year record results due to higher operating costs which included increased marketing, advertising and promotion spend and compensation and benefit integration expense of $35 million and $5 million for the nine months and third quarter of fiscal 2017, respectively. Additionally, operating income for the nine months of fiscal 2017 was impacted by $24 million of incremental net costs and lower sales volume attributable to the two plant fires. Feed costs decreased $5 million and $15 million for the nine months and third quarter of fiscal 2017, respectively.
- Prepared Foods - Sales volume increased for the nine months of fiscal 2017 due to improved demand for our retail products and incremental volumes from the AdvancePierre acquisition, partially offset by declines in foodservice. Sales volume increased in the third quarter of fiscal 2017 primarily as the result of incremental volumes from the AdvancePierre acquisition, partially offset by declines in foodservice. Average sales price was up slightly for the nine months of fiscal 2017 primarily due to better product mix attributable to the AdvancePierre acquisition, partially offset by a decline in input costs of approximately $55 million. Average sales price increased in the third quarter of fiscal 2017 due to better product mix which was positively impacted by the AdvancePierre acquisition and higher input costs of approximately $25 million. Operating income for the nine months of fiscal 2017 decreased due to an impairment of $52 million related to our San Diego operation, in addition to higher operating costs at some of our facilities, increased marketing, advertising and promotion spend, $28 million of compensation and benefit integration expense and $21 million related to AdvancePierre purchase accounting and acquisition related costs. Operating income for the third quarter of fiscal 2017 decreased due to higher operating costs at some of our facilities and $21 million related to AdvancePierre purchase accounting and acquisition related costs. Additionally, Prepared Foods operating income was positively impacted by $135 million in synergies, of which $19 million was incremental synergies in the third quarter of fiscal 2017. The positive impact of these synergies to operating income was partially offset with investments in innovation, new product launches and supporting the growth of our brands.
Outlook
In fiscal 2018, USDA indicates domestic protein production (beef, pork, chicken and turkey) should increase approximately 3-4% from fiscal 2017 levels, but strong export markets should partially offset the increase. We acquired AdvancePierre on June 7, 2017, and expect to realize net synergies in excess of $200 million within three years with the majority of these benefits realized in our Prepared Foods segment. We expect to realize synergies of around $675 million in fiscal 2017 from the Hillshire Brands acquisition as well as our profit improvement plan for our legacy Prepared Foods business with some incremental synergies expected to be realized in fiscal 2018. The majority of these benefits will be realized in our Prepared Foods segment. The following is a summary of the outlook for each of our segments, as well as an outlook on sales, capital expenditures, net interest expense, liquidity and share repurchases for the remainder of fiscal 2017 and fiscal 2018.
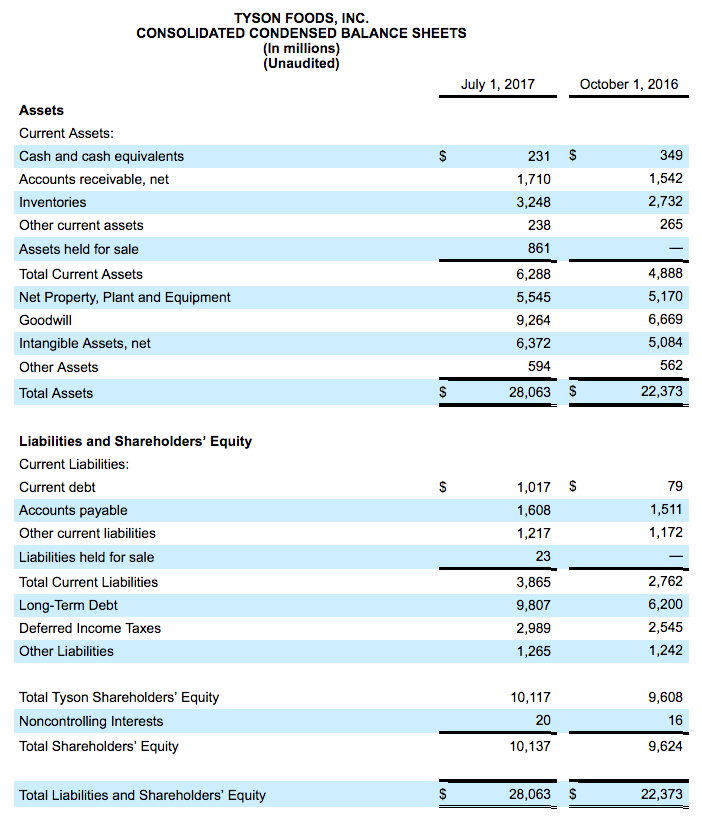
- Sale of Non-Protein Businesses – On April 24, 2017, we announced our intent to sell three non-protein businesses, Sara Lee® Frozen Bakery, Kettle and Van’s®, which are all a part of our Prepared Foods segment, as part of our strategic focus on protein-packed brands. The projected revenue of these businesses total approximately $650 million for fiscal 2017 and had a net carrying value of $838 million at July 1, 2017. We anticipate we will close the transactions by the end of calendar 2017 and expect to record a net pretax gain as a result of the sale of these businesses. Therefore, we have excluded these businesses' expected results from the fiscal 2018 outlook.
- Beef – We expect industry fed cattle supplies to increase approximately 1-2% in fiscal 2018 as compared to fiscal 2017. We expect ample supplies in regions we operate our plants. We believe our Beef segment's operating margin should be around 5% for fiscal 2017 with similar results in fiscal 2018.
- Pork – We expect industry hog supplies to increase approximately 3% in fiscal 2018 as compared to fiscal 2017. For fiscal 2017, our Pork segment's operating margin should be around 12% and remain above its normalized range of 6-8% in fiscal 2018.
- Chicken – AdvancePierre contributed approximately $20 million of revenue in the third quarter of fiscal 2017 and we anticipate approximately $80 million of AdvancePierre revenue in the fourth quarter of fiscal 2017. We expect incremental revenue of $250 million in fiscal 2018 for a total of $350 million in the first full fiscal year as part of our operation. USDA projects an increase in chicken production of approximately 2% in fiscal 2018 as compared to fiscal 2017. Based on current futures prices, we expect lower feed costs in fiscal 2017 compared to fiscal 2016 by approximately $70 million. For fiscal 2017, we believe our Chicken segment's operating margin should be approximately 10%. Based on current futures prices, we expect higher feed costs in fiscal 2018 as compared to fiscal 2017 by approximately $100 million. Many of our sales contracts are formula based or shorter-term in nature, but there may be a lag time for price changes to take effect. For fiscal 2018, we believe our Chicken segment sales will grow and operating margin should remain similar to fiscal 2017 results.
- Prepared Foods – AdvancePierre contributed approximately $100 million of revenue in the third quarter of fiscal 2017 and we anticipate approximately $350 million of AdvancePierre revenue in the fourth quarter of fiscal 2017. We expect incremental revenue of $900 million in fiscal 2018 for a total of $1.35 billion in the first full fiscal year as part of our operation. We expect to capture AdvancePierre net synergies in excess of $200 million, to be realized within three years, with the majority of these benefits being realized in our Prepared Foods segment. Synergies are expected to come from manufacturing footprint, procurement efficiencies and distribution network consolidation as well as addressing redundant sales and marketing functions and duplicative corporate overhead at the combined companies. We currently expect input costs to be flat for fiscal 2017 as compared to fiscal 2016 and similar in fiscal 2018 compared to fiscal 2017. For fiscal 2017, we expect operating margins to approximate 9% as we invest in some of our facilities to enable operational improvements and cost efficiencies as well as invest in innovation and growth of our brands. For fiscal 2018, our Prepared Foods segment sales will grow and operating margin should be in the upper half of the existing normalized range of 10-12% and we will continue to evaluate the range as we close the sale of the three non-protein businesses and integrate AdvancePierre.
- Other – Other includes our foreign operations related to raising and processing live chickens in China and India, third-party merger and integration costs and corporate overhead related to Tyson New Ventures, LLC. We expect Other operating loss should be approximately $70 million in fiscal 2017 and expect similar results in fiscal 2018, excluding the impact of merger and integration expense from the acquisition of AdvancePierre.
- Sales – We now expect fiscal 2017 sales to be above $38 billion as we grow sales volume across each segment. For fiscal 2018, we expect sales to grow to approximately $41 billion which excludes the revenue of the three non-protein businesses held for sale referenced above. The expected increase in fiscal 2018 sales is attributed to incremental AdvancePierre sales of $1.15 billion, increase in sales volume in our legacy businesses and an increase in pricing predominantly in our Chicken segment, partially offset by the exclusion of sales from the three non-protein businesses referenced above.
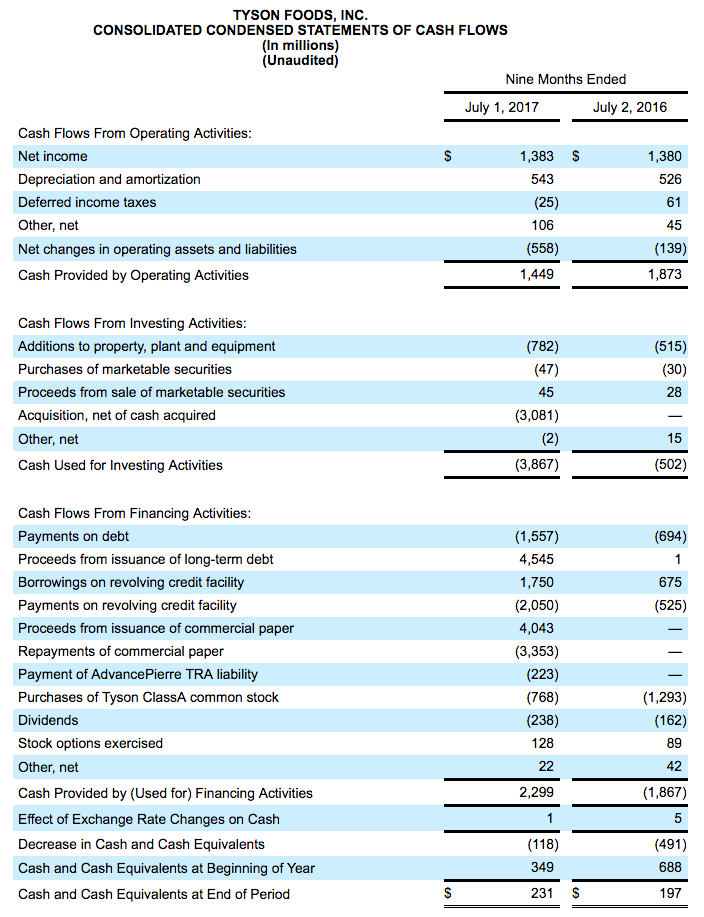
- Capital Expenditures – We expect capital expenditures to approximate $1 billion for fiscal 2017 and expect an increase for fiscal 2018. Capital expenditures will include spending for production growth, safety, animal well-being, infrastructure replacements and upgrades, and operational improvements that will result in production and labor efficiencies, yield improvements and sales channel flexibility.
- Net Interest Expense – We expect net interest expense to approximate $270 million for fiscal 2017 and $330 million for fiscal 2018, which includes estimates regarding the timing and net proceeds from the divestiture of our Sara Lee® Frozen Bakery, Kettle and Van’s®businesses as we intend to use the net sales proceeds to pay down debt.
- Liquidity – We expect total liquidity, which was approximately $1.0 billion at July 1, 2017, to remain in line with our minimum liquidity target of $1.0 billion.
- Share Repurchases – For the remainder of fiscal 2017 and for fiscal 2018, we currently do not plan to repurchase shares other than to fund obligations under equity compensation programs.
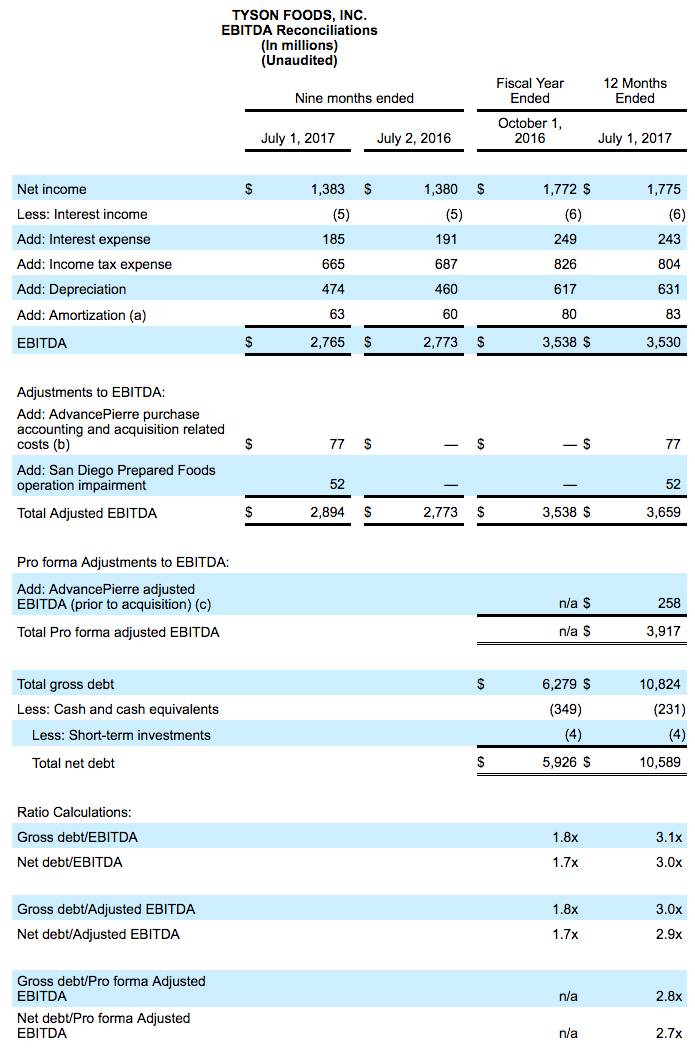

(a) Excludes the amortization of debt discount expense of $6 million for the nine months ended July 1, 2017, and July 2, 2016, and $8 million for the fiscal year ended October 1, 2016, and for the twelve months ended July 1, 2017, as it is included in interest expense.
(b) AdvancePierre acquisition and integration costs includes $24 million of purchase accounting adjustments, $35 million acquisition related costs and $18 million of acquisition bridge financing fees.
(c) Represents AdvancePierre's pre-acquisition adjusted EBITDA, for the approximate eleven months ended prior to the June 7, 2017, closing of the acquisition. These amounts are added to our Adjusted EBITDA for the twelve months ended July 1, 2017, in order for Net debt to Adjusted EBITDA to include a full twelve months of AdvancePierre results on a pro forma basis for the twelve months ended July 1, 2017. The pro forma adjusted EBITDA was derived from AdvancePierre’s EBITDA from its historical unaudited financial statements for the three months ended October 1, 2016, December 31, 2016 and April 1, 2017 as filed with the Securities and Exchange Commission, as well as AdvancePierre management unaudited financial information for the period from April 2, 2017 through the June 7, 2017, closing of the acquisition. These amounts were adjusted to remove the impact of its merger acquisition and public filing expenses and related expenses including consultant fees, accelerated stock-based compensation and other deal costs. We believe this pro forma presentation is useful and helps management, investors, and rating agencies enhance their understanding of our financial performance and to better highlight future financial trends on a comparable basis with AdvancePierre results included for the twelve months ended July 1, 2017 given the significance of the acquisition to our overall results.
EBITDA is defined as net income before interest, income taxes, depreciation and amortization. Net debt to EBITDA (Adjusted EBITDA and Pro forma Adjusted EBITDA) represents the ratio of our debt, net of cash and short-term investments, to EBITDA (and to Adjusted EBITDA and Pro forma Adjusted EBITDA). EBITDA, Adjusted EBITDA, net debt to EBITDA and net debt to Adjusted EBITDA (and to Pro forma Adjusted EBITDA) are presented as supplemental financial measurements in the evaluation of our business. Adjusted EBITDA is a tool intended to assist our management and investors in comparing our performance on consistent basis for purposes of business decision-making by removing the impact of certain items that management believes do not directly reflect our core operations on an ongoing basis.
We believe the presentation of these financial measures helps management and investors to assess our operating performance from period to period, including our ability to generate earnings sufficient to service our debt, and enhances understanding of our financial performance and highlights operational trends. These measures are widely used by investors and rating agencies in the valuation, comparison, rating and investment recommendations of companies; however, the measurements of EBITDA (and Adjusted EBITDA and Pro forma Adjusted EBITDA) and net debt to EBITDA (and to Adjusted EBITDA and Pro forma Adjusted EBITDA) may not be comparable to those of other companies, which limits their usefulness as comparative measures. EBITDA (and Adjusted EBITDA and Pro forma Adjusted EBITDA) and net debt to EBITDA (and to Adjusted EBITDA and Pro forma Adjusted EBITDA) are not measures required by or calculated in accordance with generally accepted accounting principles (GAAP) and should not be considered as substitutes for net income or any other measure of financial performance reported in accordance with GAAP or as a measure of operating cash flow or liquidity. EBITDA (and Adjusted EBITDA and Pro forma Adjusted EBITDA) is a useful tool for assessing, but is not a reliable indicator of, our ability to generate cash to service our debt obligations because certain of the items added to net income to determine EBITDA (and Adjusted EBITDA and Pro forma Adjusted EBITDA) involve outlays of cash. As a result, actual cash available to service our debt obligations will be different from EBITDA (and Adjusted EBITDA and Pro forma Adjusted EBITDA). Investors should rely primarily on our GAAP results and use non-GAAP financial measures only supplementally in making investment decisions.
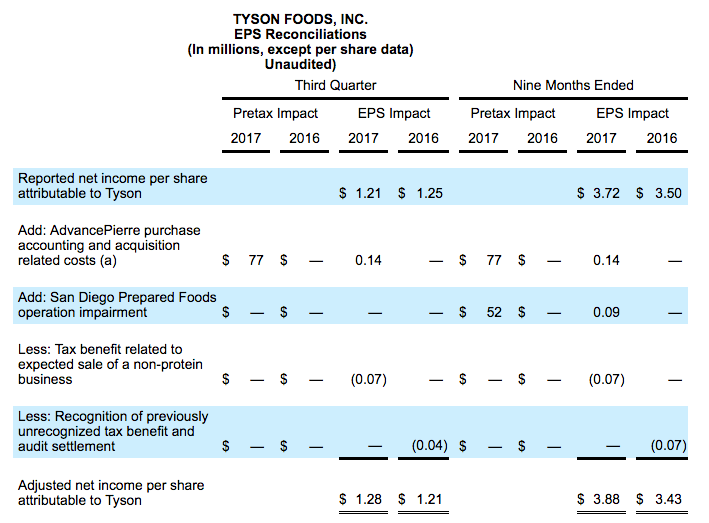
(a) AdvancePierre purchase accounting and acquisition related costs includes a $24 million purchase accounting adjustment for the fair value step-up of inventory, $35 million of acquisition related costs and $18 million of acquisition bridge financing fees.
Adjusted net income per share attributable to Tyson (adjusted EPS) is presented as a supplementary measure of our financial performance that is not required by, or presented in accordance with, GAAP. We use adjusted EPS as an internal performance measurement and as one criterion for evaluating our performance relative to that of our peers. We believe adjusted EPS is meaningful to our investors to enhance their understanding of our financial performance and is frequently used by securities analysts, investors and other interested parties to compare our performance with the performance of other companies that report adjusted EPS. Further, we believe that adjusted EPS is a useful measure because it improves comparability of results of operations from period to period. Adjusted EPS should not be considered a substitute for net income per share attributable to Tyson or any other measure of financial performance reported in accordance with GAAP. Investors should rely primarily on our GAAP results and use non-GAAP financial measures only supplementally in making investment decisions. Our calculation of adjusted EPS may not be comparable to similarly titled measures reported by other companies.
Adjusted net income per share attributable to Tyson guidance is provided on a non-GAAP basis. The Company is not able to reconcile its full-year fiscal 2017 Adjusted EPS guidance to its full-year fiscal 2017 projected GAAP EPS guidance because certain information necessary to calculate such measure on a GAAP basis is unavailable or dependent on the timing of future events outside of our control. Therefore, because of the uncertainty and variability of the nature of the amount of future adjustments, which could be significant, the Company is unable to provide a reconciliation of this measure without unreasonable effort.
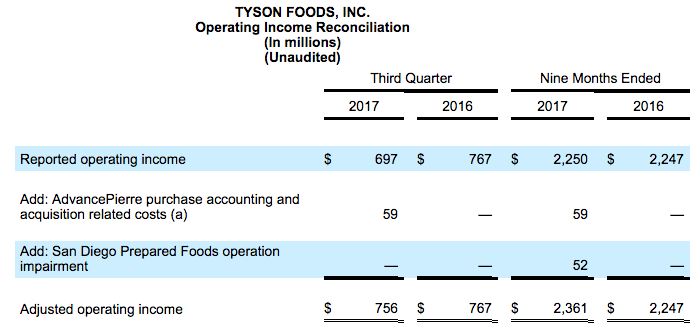
(a) AdvancePierre purchase accounting and acquisition related costs impacting operating income includes a $24 million purchase accounting adjustment for the fair value step-up of inventory and $35 million of acquisition related costs.
Adjusted operating income is presented as a supplementary measure of our operating performance that is not required by, or presented in accordance with, GAAP. We use adjusted operating income as an internal performance measurement and as one criterion for evaluating our performance relative to that of our peers. We believe adjusted operating income is meaningful to our investors to enhance their understanding of our operating performance and is frequently used by securities analysts, investors and other interested parties to compare our performance with the performance of other companies that report adjusted operating income. Further, we believe that adjusted operating income is a useful measure because it improves comparability of results of operations from period to period. Adjusted operating income should not be considered as a substitute for operating income or any other measure of operating performance reported in accordance with GAAP. Investors should rely primarily on our GAAP results and use non-GAAP financial measures only supplementally in making investment decisions. Our calculation of adjusted operating income may not be comparable to similarly titled measures reported by other companies.
Tyson Foods Inc. (NYSE: TSN) is one of the world’s largest food companies and a recognized leader in protein. Founded in 1935 by John W. Tyson and grown under three generations of family leadership, the company has a broad portfolio of products and brands like Tyson®, Jimmy Dean®, Hillshire Farm®, Ball Park®, Wright®, Aidells®, ibp® and State Fair®. Tyson Foods innovates continually to make protein more sustainable, tailor food for everywhere it’s available and raise the world’s expectations for how much good food can do. Headquartered in Springdale, Arkansas, the company has 114,000 team members. Through its Core Values, Tyson Foods strives to operate with integrity, create value for its shareholders, customers, communities and team members and serve as stewards of the animals, land and environment entrusted to it. Visit www.tysonfoods.com.
A conference call to discuss the Company's financial results will be held at 9 a.m. eastern Monday, August 7, 2017. Participants may pre-register for the call at http://dpregister.com/10110757. Callers who pre-register will be given a conference passcode and unique PIN to gain immediate access to the call and bypass the live operator. Participants may pre-register at any time, including up to and after the call start time. Those without internet access or who are unable to pre-register may dial-in by calling toll free 1-844-890-1795 or international toll 1-412-717-9589.
A live webcast, including slides, will be available on the Tyson Foods Investor Relations website at http://ir.tyson.com. The webcast also can be accessed by using the direct link https://event.on24.com/wcc/r/1470513/A41461A6928AAAE8341AC6DBACFEE9B1. A replay of the call will be available until September 7, 2017, toll free at 1-877-344-7529, international toll 1-412-317-0088 or Canada toll free 855-669-9658. The replay access code is 10110757. Financial information, such as this news release, as well as other supplemental data, can be accessed from the Company's web site at http://ir.tyson.com.
To download TSN’s free investor relations app, which offers access to SEC filings, news releases, transcripts, webcasts and presentations, please visit the App Store for iPhone and iPad or Google Play for Android mobile devices.
Forward-Looking Statements
Certain information contained in the press release may constitute forward-looking statements, including but not limited to statements relating to expected performance, statements appearing in the “Outlook” section and statements relating to adjusted EPS guidance and synergies estimates. These forward-looking statements are subject to a number of factors and uncertainties which could cause our actual results and experiences to differ materially from the anticipated results and expectations expressed in such forward-looking statements. We wish to caution readers not to place undue reliance on any forward-looking statements, which speak only as of the date made. Among the factors that may cause actual results and experiences to differ from anticipated results and expectations expressed in such forward-looking statements are the following: (i) the effect of, or changes in, general economic conditions; (ii) fluctuations in the cost and availability of inputs and raw materials, such as live cattle, live swine, feed grains (including corn and soybean meal) and energy; (iii) market conditions for finished products, including competition from other global and domestic food processors, supply and pricing of competing products and alternative proteins and demand for alternative proteins; (iv) successful rationalization of existing facilities and operating efficiencies of the facilities; (v) risks associated with our commodity purchasing activities; (vi) access to foreign markets together with foreign economic conditions, including currency fluctuations, import/export restrictions and foreign politics; (vii) outbreak of a livestock disease (such as avian influenza (AI) or bovine spongiform encephalopathy (BSE)), which could have an adverse effect on livestock we own, the availability of livestock we purchase, consumer perception of certain protein products or our ability to access certain domestic and foreign markets; (viii) changes in availability and relative costs of labor and contract growers and our ability to maintain good relationships with employees, labor unions, contract growers and independent producers providing us livestock; (ix) issues related to food safety, including costs resulting from product recalls, regulatory compliance and any related claims or litigation; (x) changes in consumer preference and diets and our ability to identify and react to consumer trends; (xi) significant marketing plan changes by large customers or loss of one or more large customers; (xii) adverse results from litigation; (xiii) impacts on our operations caused by factors and forces beyond our control, such as natural disasters, fire, bioterrorism, pandemics or extreme weather; (xiv) risks associated with leverage, including cost increases due to rising interest rates or changes in debt ratings or outlook; (xv) compliance with and changes to regulations and laws (both domestic and foreign), including changes in accounting standards, tax laws, environmental laws, agricultural laws and occupational, health and safety laws; (xvi) our ability to make effective acquisitions or joint ventures and successfully integrate newly acquired businesses into existing operations; (xvii) cyber incidents, security breaches or other disruptions of our information technology systems; (xviii) effectiveness of advertising and marketing programs; and (xix) those factors listed under Item 1A. “Risk Factors” included in our Annual Report filed on Form 10-K for the period ended October 1, 2016 and subsequently filed Quarterly Reports on Form 10-Q and Current Reports on Form 8-K.
####
Media Contact:
Gary Mickelson, 479-290-6111, gary.mickelson@tyson.com
Investor Contact:
Jon Kathol, 479-290-4235, jon.kathol@tyson.com