
Springdale, Arkansas – February 6, 2017 – Tyson Foods, Inc. (NYSE: TSN), one of the world's largest food companies with leading brands including Tyson®, Jimmy Dean®, Hillshire Farm®, Sara Lee®, Ball Park®, Wright®, Aidells® and State Fair®, today reported the following results:
First Quarter Highlights
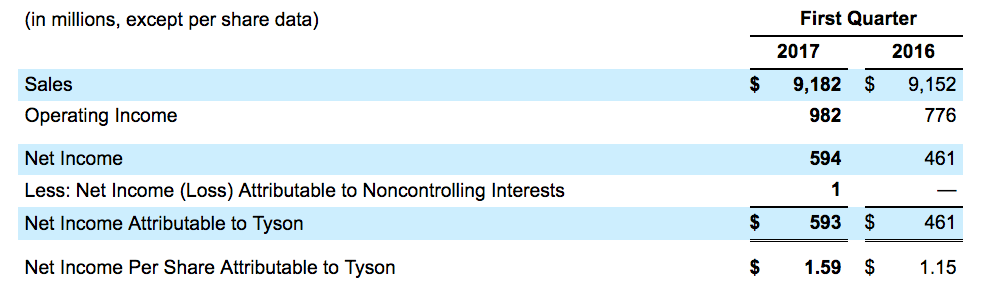
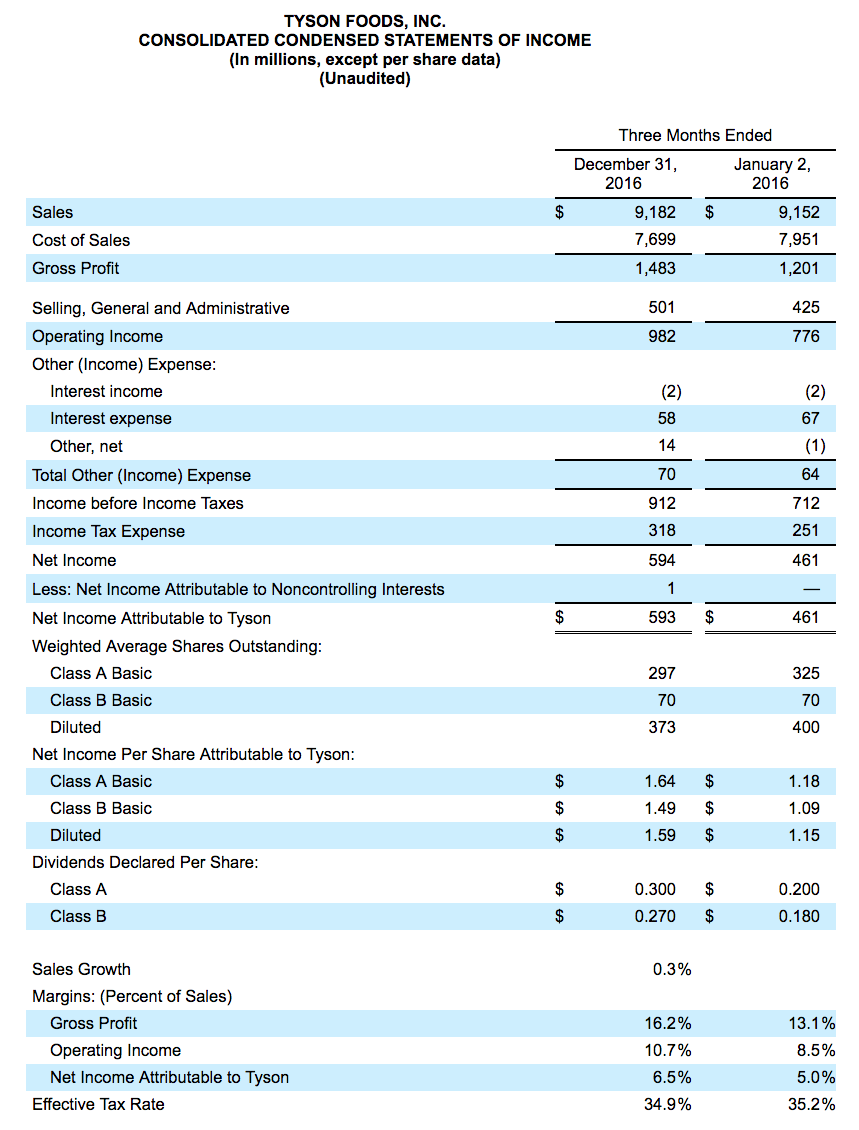
- Record EPS of $1.59, up 38% from Q1'16
- Record Operating income up 27% to $982 million
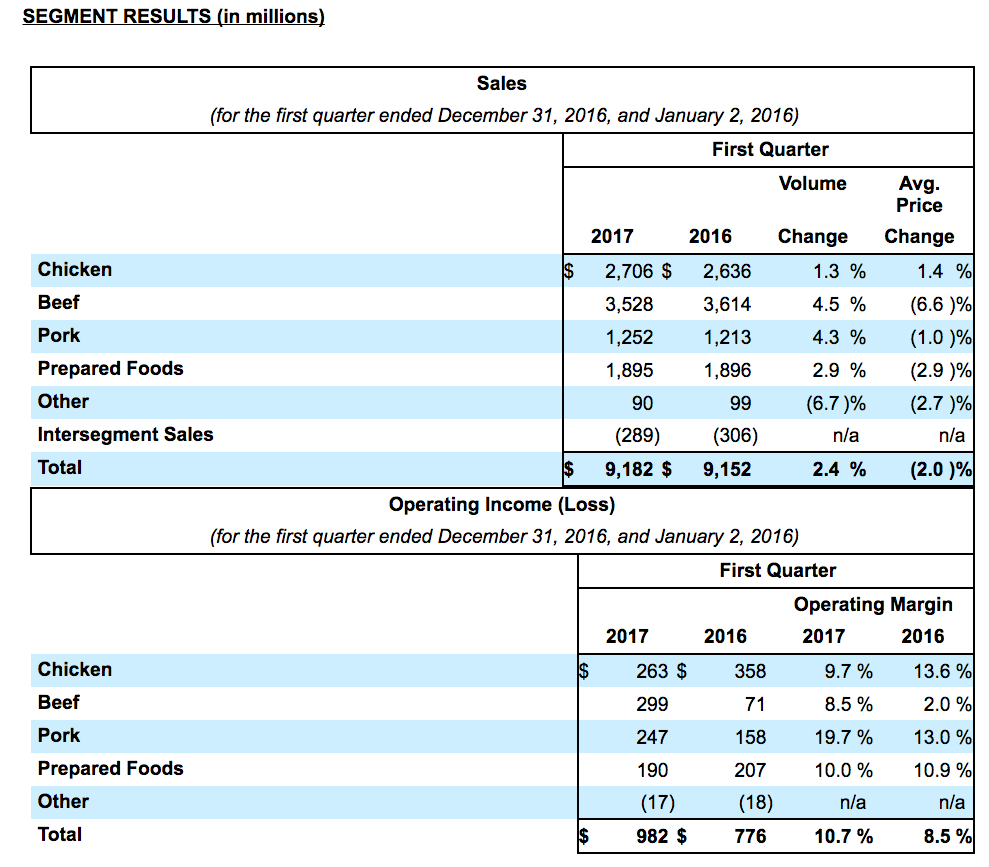
- Total Company sales volume increased 2.4% from Q1'16; all segments sales volume up from prior year
- Record total company operating margin at 10.7%
◦ Record Pork segment operating margin at 19.7%
◦ Record Beef segment operating margin at 8.5%
◦ Chicken and Prepared Foods segment operating margin within normalized range
- Captured $161 million in total synergies; $40 million incremental synergies over Q1'16
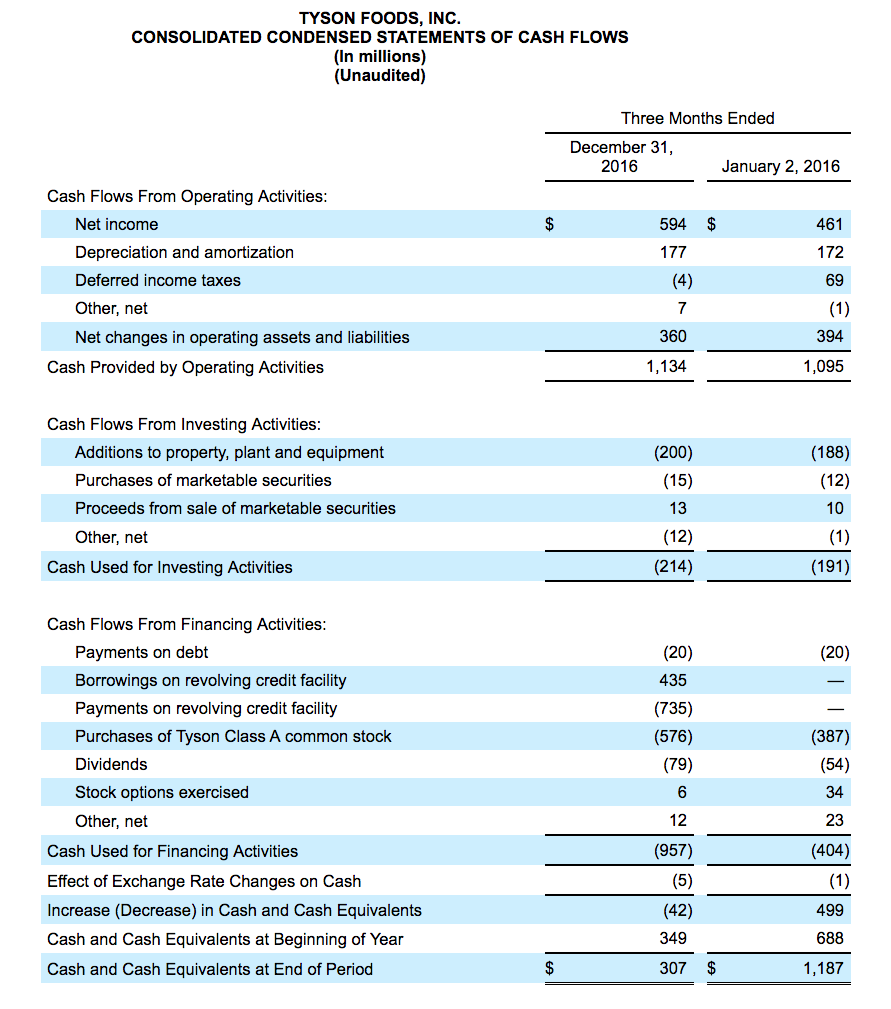
- Record operating cash flows of over $1.1 billion
- Repurchased 8.1 million shares for $520 million, excluding shares repurchased to offset dilution from our equity compensation plan
Fiscal 2017 Guidance
- Steps up EPS guidance to $4.90-$5.05, representing a 12% increase from adjusted EPS of fiscal 2016
“The year is off to the best start in company history with record earnings, record operating income and record cash flows,” said Tom Hayes, president and chief executive officer of Tyson Foods. “Return on sales for each operating segment was in or above the normalized range. The tremendous returns generated in the Beef and Pork segments are providing fuel for growth in our value-added Chicken and Prepared Foods segments.
“Tyson Foods again led retail food manufacturers in both sales volume and sales dollars for the 13-week period corresponding with our fiscal first quarter. Not only did we lead in sales volume, according to IRI, we were the only company to show volume growth among the top 10 branded food companies.
“Due to our outstanding performance in Beef and Pork and strong market conditions in the first quarter, we are raising our annual earnings guidance to $4.90-5.05 per share. We expect the earnings cadence for the remainder of the fiscal year to follow more normal patterns, including the seasonality typical of our second quarter.
“We’re on a path toward what we expect to be our fifth straight year of record results. Our path won’t be linear, but our team is focused on delivering long-term growth and creating shareholder value.”
Summary of Segment Results
- Chicken - Sales volume increased as a result of better demand for our chicken products, partially offset by a decrease in rendered product sales. Average sales price increased as a result of sales mix changes which offset general market price declines. Operating income decreased due to increased marketing, advertising and promotion spend and higher operating costs which included $23 million of compensation and benefit integration expense. Feed costs decreased $20 million during the first quarter of fiscal 2017.
- Beef - Sales volume increased due to improved availability of cattle supply and stronger domestic and export demand for our beef products. Average sales price decreased due to higher domestic availability of beef supplies and lower livestock cost. Operating income increased due to more favorable market conditions as we maximized our revenues relative to the decline in live fed cattle costs, partially offset by higher operating costs.
- Pork - Sales volume increased due to strong demand for our pork products and increased exports. Live hog supplies increased, which drove down livestock cost and average sales price. Operating income increased as we maximized our revenues relative to the live hog markets, partially attributable to stronger export markets and operational and mix performance, which were partially offset by higher operating costs.
- Prepared Foods - Sales volume increased due to improved demand for our prepared foods products. Average sales price decreased primarily due to a decline in input costs of approximately $100 million, partially offset by product mix changes. Operating income decreased due to higher operating costs at some of our facilities, increased marketing, advertising and promotion spend and $22 million of compensation and benefit integration expense. Additionally, Prepared Foods operating income was positively impacted by $127 million in synergies, of which $32 million was incremental synergies in the first quarter of fiscal 2017 above the $95 million of synergies realized in the first quarter of fiscal 2016. The positive impact of these synergies to operating income was partially offset with investments in innovation, new product launches and supporting the growth of our brands.
Outlook
In fiscal 2017, USDA indicates domestic protein production (chicken, beef, pork and turkey) should increase approximately 2-3% from fiscal 2016 levels and moderate export growth. As we continue with the integration of Hillshire Brands, we expect to realize synergies of around $675 million in fiscal 2017 from the acquisition as well as our profit improvement plan for our legacy Prepared Foods business with some incremental synergies expected to be realized in fiscal 2018. The majority of these benefits will be realized in our Prepared Foods segment. The following is a summary of the outlook for each of our segments, as well as an outlook on sales, capital expenditures, net interest expense, liquidity and share repurchases for fiscal 2017.
- Chicken – USDA shows an increase in chicken production of approximately 2% in fiscal 2017 as compared to fiscal 2016. Based on current futures prices, we expect similar feed costs in fiscal 2017 as compared to fiscal 2016. For fiscal 2017, our Chicken segment's operating margin should be at the upper end of its normalized range of 9-11%.
- Beef – We expect industry fed cattle supplies to increase approximately 3-4% in fiscal 2017 as compared to fiscal 2016. We generally expect adequate supplies in regions we operate our plants. For fiscal 2017, our Beef segment's operating margin should be around 5%.
- Pork – We expect industry hog supplies to increase approximately 3-4% in fiscal 2017 as compared to fiscal 2016. For fiscal 2017, our Pork segment's operating margin should be around 12%.
- Prepared Foods – We currently expect input costs to be flat for the remainder of fiscal 2017 as compared to fiscal 2016. For fiscal 2017, we now expect operating margins to be a little below fiscal 2016 as we invest in innovation and growth of our brands as well as invest in some of our facilities to enable operational improvements and cost efficiencies.
- Other – Other includes our foreign operations related to raising and processing live chickens in China and India, third-party merger and integration costs and corporate overhead related to Tyson New Ventures, LLC. We expect Other operating loss should be approximately $70 million in fiscal 2017.
- Sales – For fiscal 2017, we expect sales to be flat compared to fiscal 2016 as we grow sales volume across each segment, offset by the impact of lower beef prices.
- Capital Expenditures – We expect capital expenditures to approximate $1.0 billion for fiscal 2017 and will include spending for production growth, safety, animal well-being, infrastructure replacements and upgrades, and operational improvements that will result in production and labor efficiencies, yield improvements and sales channel flexibility.
- Net Interest Expense – We expect net interest expense to approximate $230 million for fiscal 2017.
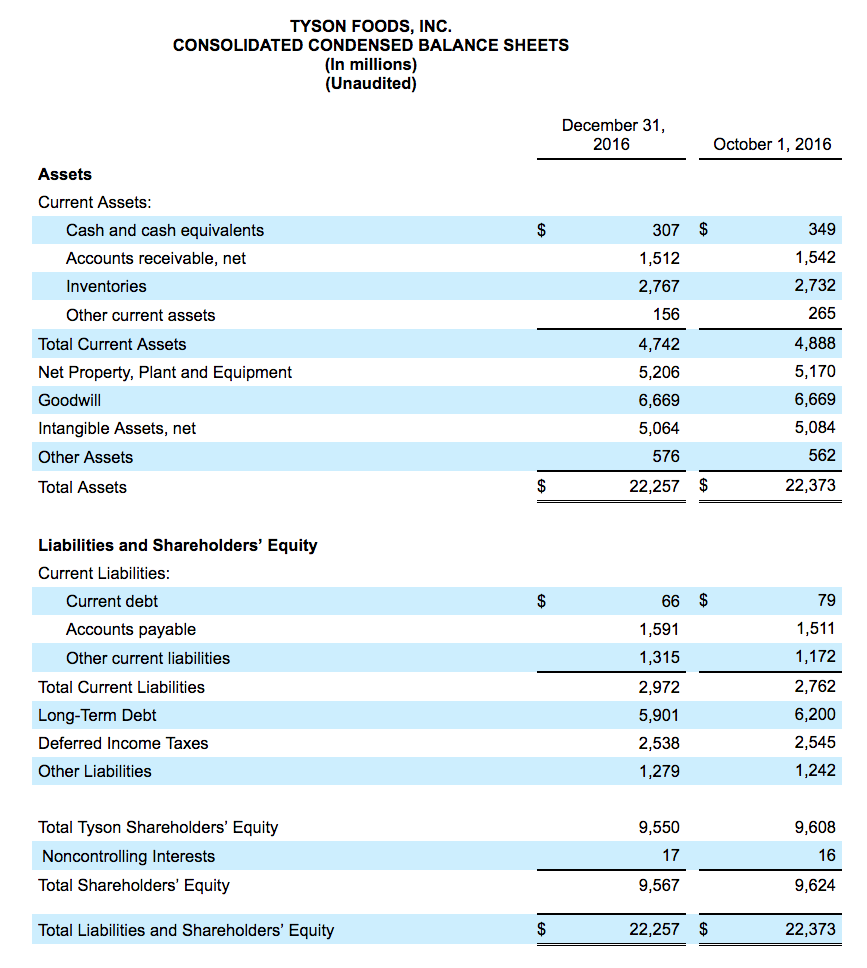
- Liquidity – We expect total liquidity, which was $1.6 billion at December 31, 2016, to remain in line with our minimum liquidity target of $1.0 billion.
- Share Repurchases – In fiscal 2017, we expect to continue our share repurchases under our share repurchase program. As of December 31, 2016, 31.7 million shares remain authorized for repurchases. The timing and extent to which we repurchase shares will depend upon, among other things, our working capital needs, market conditions, liquidity targets, our debt obligations and regulatory requirements.
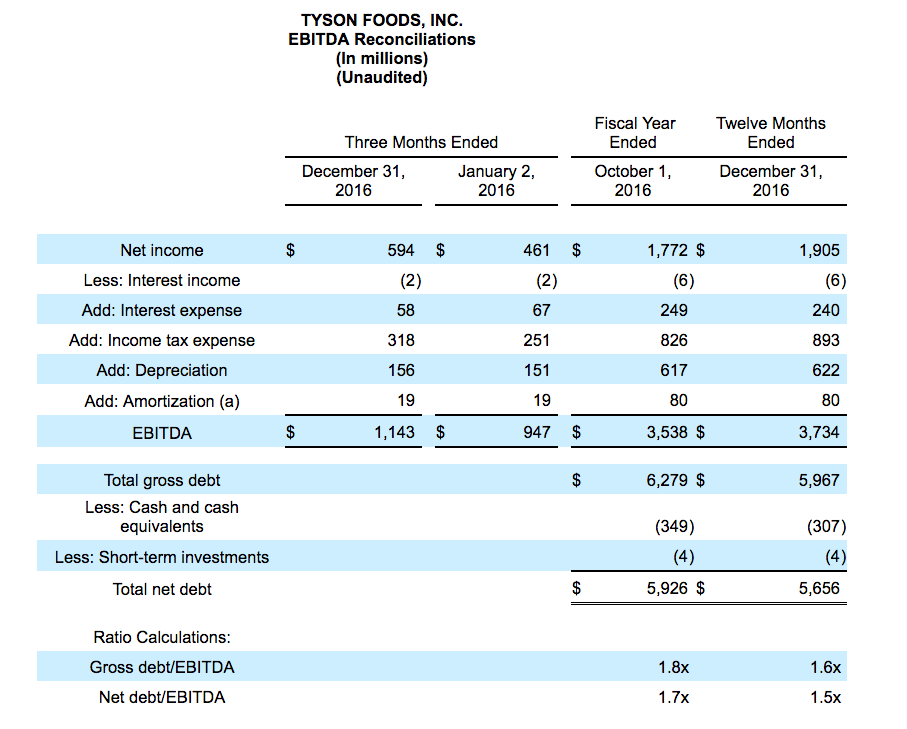
(a) Excludes the amortization of debt discount expense of $2 million for the three months ended December 31, 2016, and January 2, 2016, and $8 million for the fiscal year ended October 1, 2016, and for the twelve months ended December 31, 2016, as it is included in Interest expense.
EBITDA is defined as net income before interest, income taxes, depreciation and amortization. Net debt to EBITDA represents the ratio of our debt, net of cash and short-term investments, to EBITDA. EBITDA and net debt to EBITDA are presented as supplemental financial measurements in the evaluation of our business. We believe the presentation of these financial measures helps management and investors to assess our operating performance from period to period, including our ability to generate earnings sufficient to service our debt, and enhances understanding of our financial performance and highlights operational trends. These measures are widely used by investors and rating agencies in the valuation, comparison, rating and investment recommendations of companies; however, the measurements of EBITDA and net debt to EBITDA may not be comparable to those of other companies, which limits their usefulness as comparative measures. EBITDA and net debt to EBITDA are not measures required by or calculated in accordance with generally accepted accounting principles (GAAP) and should not be considered as substitutes for net income or any other measure of financial performance reported in accordance with GAAP or as a measure of operating cash flow or liquidity. EBITDA is a useful tool for assessing, but is not a reliable indicator of, our ability to generate cash to service our debt obligations because certain of the items added to net income to determine EBITDA involve outlays of cash. As a result, actual cash available to service our debt obligations will be different from EBITDA. Investors should rely primarily on our GAAP results and use non-GAAP financial measures only supplementally in making investment decisions.
Tyson Foods, Inc., with headquarters in Springdale, Arkansas, is one of the world's largest food companies with leading brands such as Tyson®, Jimmy Dean®, Hillshire Farm®, Sara Lee®, Ball Park®, Wright®, Aidells® and State Fair®. It’s a recognized market leader in chicken, beef and pork as well as prepared foods, including bacon, breakfast sausage, turkey, lunchmeat, hot dogs, pizza crusts and toppings, tortillas and desserts. The company supplies retail and foodservice customers throughout the United States and approximately 115 countries. Tyson Foods was founded in 1935 by John W. Tyson, whose family has continued to lead the business with his son, Don Tyson, guiding the company for many years and grandson, John H. Tyson, serving as the current chairman of the board of directors. At October 1, 2016, the company had approximately 114,000 Team Members employed at more than 400 facilities and offices in the United States and around the world. Through its Core Values, Code of Conduct and Team Member Bill of Rights, Tyson Foods strives to operate with integrity and trust and is committed to creating value for its shareholders, customers and Team Members. The company also strives to be faith-friendly, provide a safe work environment and serve as stewards of the animals, land and environment entrusted to it.
A conference call to discuss the Company's financial results will be held at 9 a.m. eastern Monday, February 6, 2017. Participants may pre-register for the call at http://dpregister.com/10099233. Callers who pre-register will be given a conference passcode and unique PIN to gain immediate access to the call and bypass the live operator. Participants may pre-register at any time, including up to and after the call start time. Those without internet access or who are unable to pre-register may dial-in by calling toll free 1-844-890-1795 or international toll 1-412-717-9589.
A live webcast, including slides, will be available on the Tyson Foods Investor Relations website at http://ir.tyson.com. The webcast also can be accessed by using the direct link http://event.on24.com/wcc/r/1289467/63648A7227D83EF43544FBEB01D71570.
A replay of the call will be available until March 6, 2017, toll free at 1-877-344-7529, international toll 1-412-317-0088 or Canada toll free 855-669-9658. The replay access code is 10099233. Financial information, such as this news release, as well as other supplemental data, can be accessed from the Company's web site at http://ir.tyson.com.
To download TSN’s free investor relations app, which offers access to SEC filings, news releases, transcripts, webcasts and presentations, please visit the App Store for iPhone and iPad or Google Play for Android mobile devices.
Forward-Looking Statements
Certain information contained in the press release may constitute forward-looking statements, such as statements relating to expected performance, and including, but not limited to, statements appearing in the “Outlook” section and statements relating to GAAP EPS guidance and adjusted EPS guidance. These forward-looking statements are subject to a number of factors and uncertainties which could cause our actual results and experiences to differ materially from the anticipated results and expectations expressed in such forward-looking statements. We wish to caution readers not to place undue reliance on any forward-looking statements, which speak only as of the date made. Among the factors that may cause actual results and experiences to differ from anticipated results and expectations expressed in such forward-looking statements are the following: (i) the effect of, or changes in, general economic conditions; (ii) fluctuations in the cost and availability of inputs and raw materials, such as live cattle, live swine, feed grains (including corn and soybean meal) and energy; (iii) market conditions for finished products, including competition from other global and domestic food processors, supply and pricing of competing products and alternative proteins and demand for alternative proteins; (iv) successful rationalization of existing facilities and operating efficiencies of the facilities; (v) risks associated with our commodity purchasing activities; (vi) access to foreign markets together with foreign economic conditions, including currency fluctuations, import/export restrictions and foreign politics; (vii) outbreak of a livestock disease (such as avian influenza (AI) or bovine spongiform encephalopathy (BSE)), which could have an adverse effect on livestock we own, the availability of livestock we purchase, consumer perception of certain protein products or our ability to access certain domestic and foreign markets; (viii) changes in availability and relative costs of labor and contract growers and our ability to maintain good relationships with employees, labor unions, contract growers and independent producers providing us livestock; (ix) issues related to food safety, including costs resulting from product recalls, regulatory compliance and any related claims or litigation; (x) changes in consumer preference and diets and our ability to identify and react to consumer trends; (xi) significant marketing plan changes by large customers or loss of one or more large customers; (xii) adverse results from litigation; (xiii) impacts on our operations caused by factors and forces beyond our control, such as natural disasters, fire, bioterrorism, pandemics or extreme weather; (xiv) risks associated with leverage, including cost increases due to rising interest rates or changes in debt ratings or outlook; (xv) compliance with and changes to regulations and laws (both domestic and foreign), including changes in accounting standards, tax laws, environmental laws, agricultural laws and occupational, health and safety laws; (xvi) our ability to make effective acquisitions or joint ventures and successfully integrate newly acquired businesses into existing operations; (xvii) cyber incidents, security breaches or other disruptions of our information technology systems; (xviii) effectiveness of advertising and marketing programs; and (xix) those factors listed under Item 1A. “Risk Factors” included in our Annual Report filed on Form 10-K for the period ended October 1, 2016.
Media Contact: Gary Mickelson, 479-290-6111
Investor Contact: Jon Kathol, 479-290-4235